Human Footprint
Summary of the status (circa 2023) and trend (1950-2023) of human footprint in the Al-Pac FMA area.
.svg)
(5,784 km2)
(3,708 km2)
- Since 2000, total human footprint has increased by 4.7 percentage points to cover 9.1% of the area.
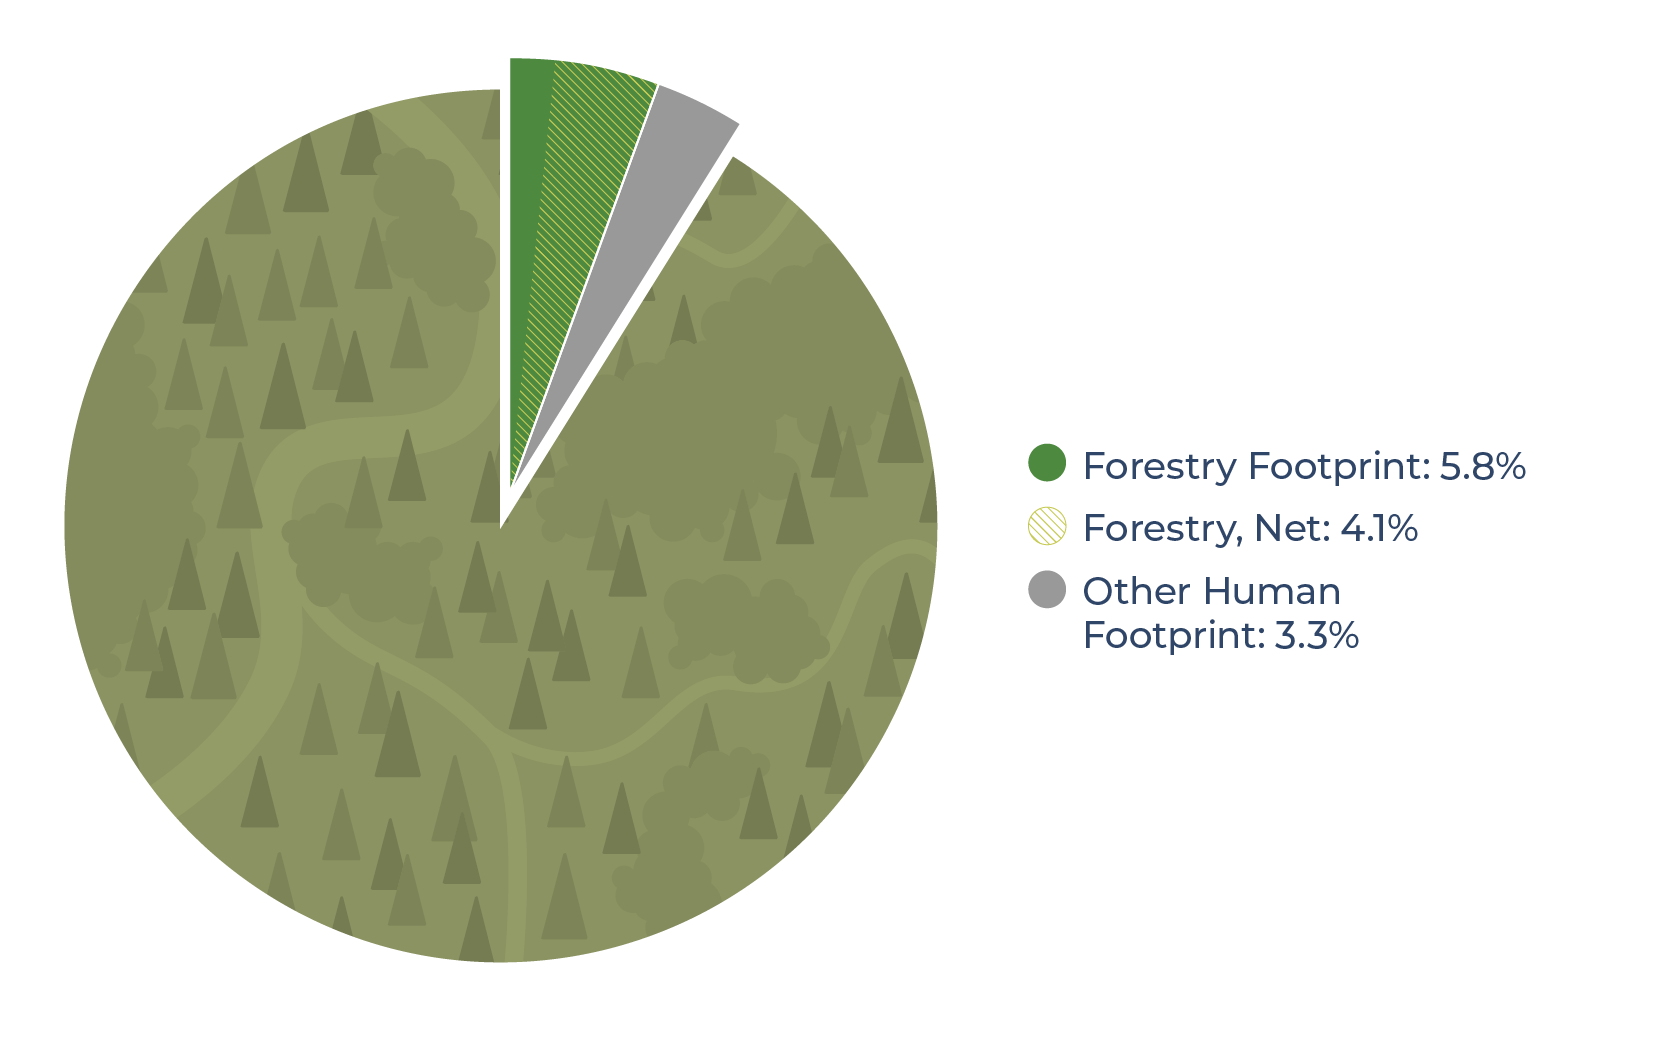
- Forestry was the largest contributor, representing 5.8% of the area, followed by the energy sector (2.4%), with all other footprint types each covering less than 1%.
- Forestry footprint increased by 3.0 percentage points since 2000 (from 2.9% to 5.8%), though when regenerating harvested areas are accounted for, net forestry footprint increased by 1.5 percentage points (from 2.6% to 4.1%).
Methods for summarizing human footprint are described in Section 1.3.2.

Introduction
- In the Al-Pac FMA area, the forestry and energy industries are the principal sources of human footprint. Al-Pac operates across the FMA area, managing approximately 64,000 km2, with 19,000 km2 designated as harvestable forest. Other forest companies operate in one or more smaller Forest Management Units that make up the full FMA area. Approximately 1,100 km2 of active oil sands projects lie within the FMA boundary but are not part of the FMA area itself[2].
- Measuring human footprint—such as harvest areas, well pads, and roads—is essential for tracking landscape changes, understanding biodiversity impacts, and supporting habitat restoration and reclamation efforts[3].
- Integrated land management (ILM)[4] is a key strategy for reducing the impact of development on species and habitats, and is identified as a specific objective as part of Al-Pac’s forest management planning[2]. Through coordinated land-use planning and ILM agreements, Al-Pac has collaborated with energy firms to share transportation corridors, minimizing human impact and the cumulative effects of forestry, energy, and transportation activities in the FMA area[2,5,6].
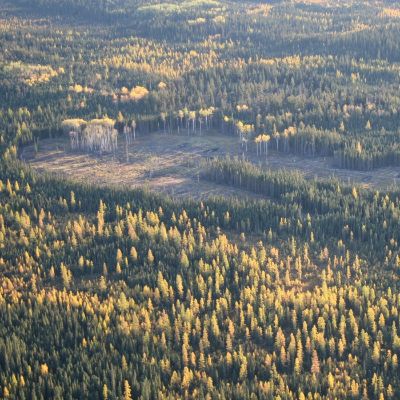
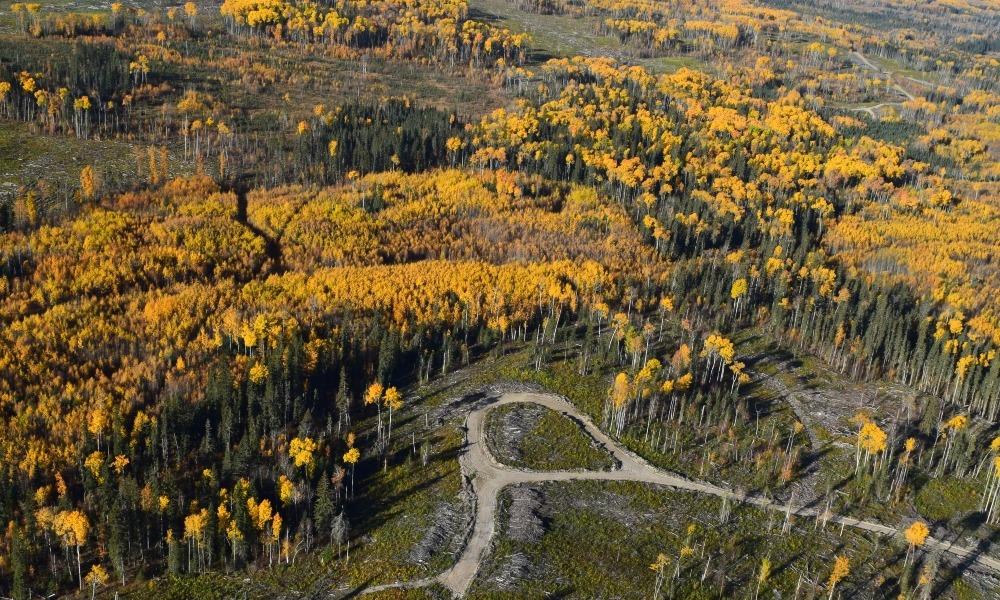
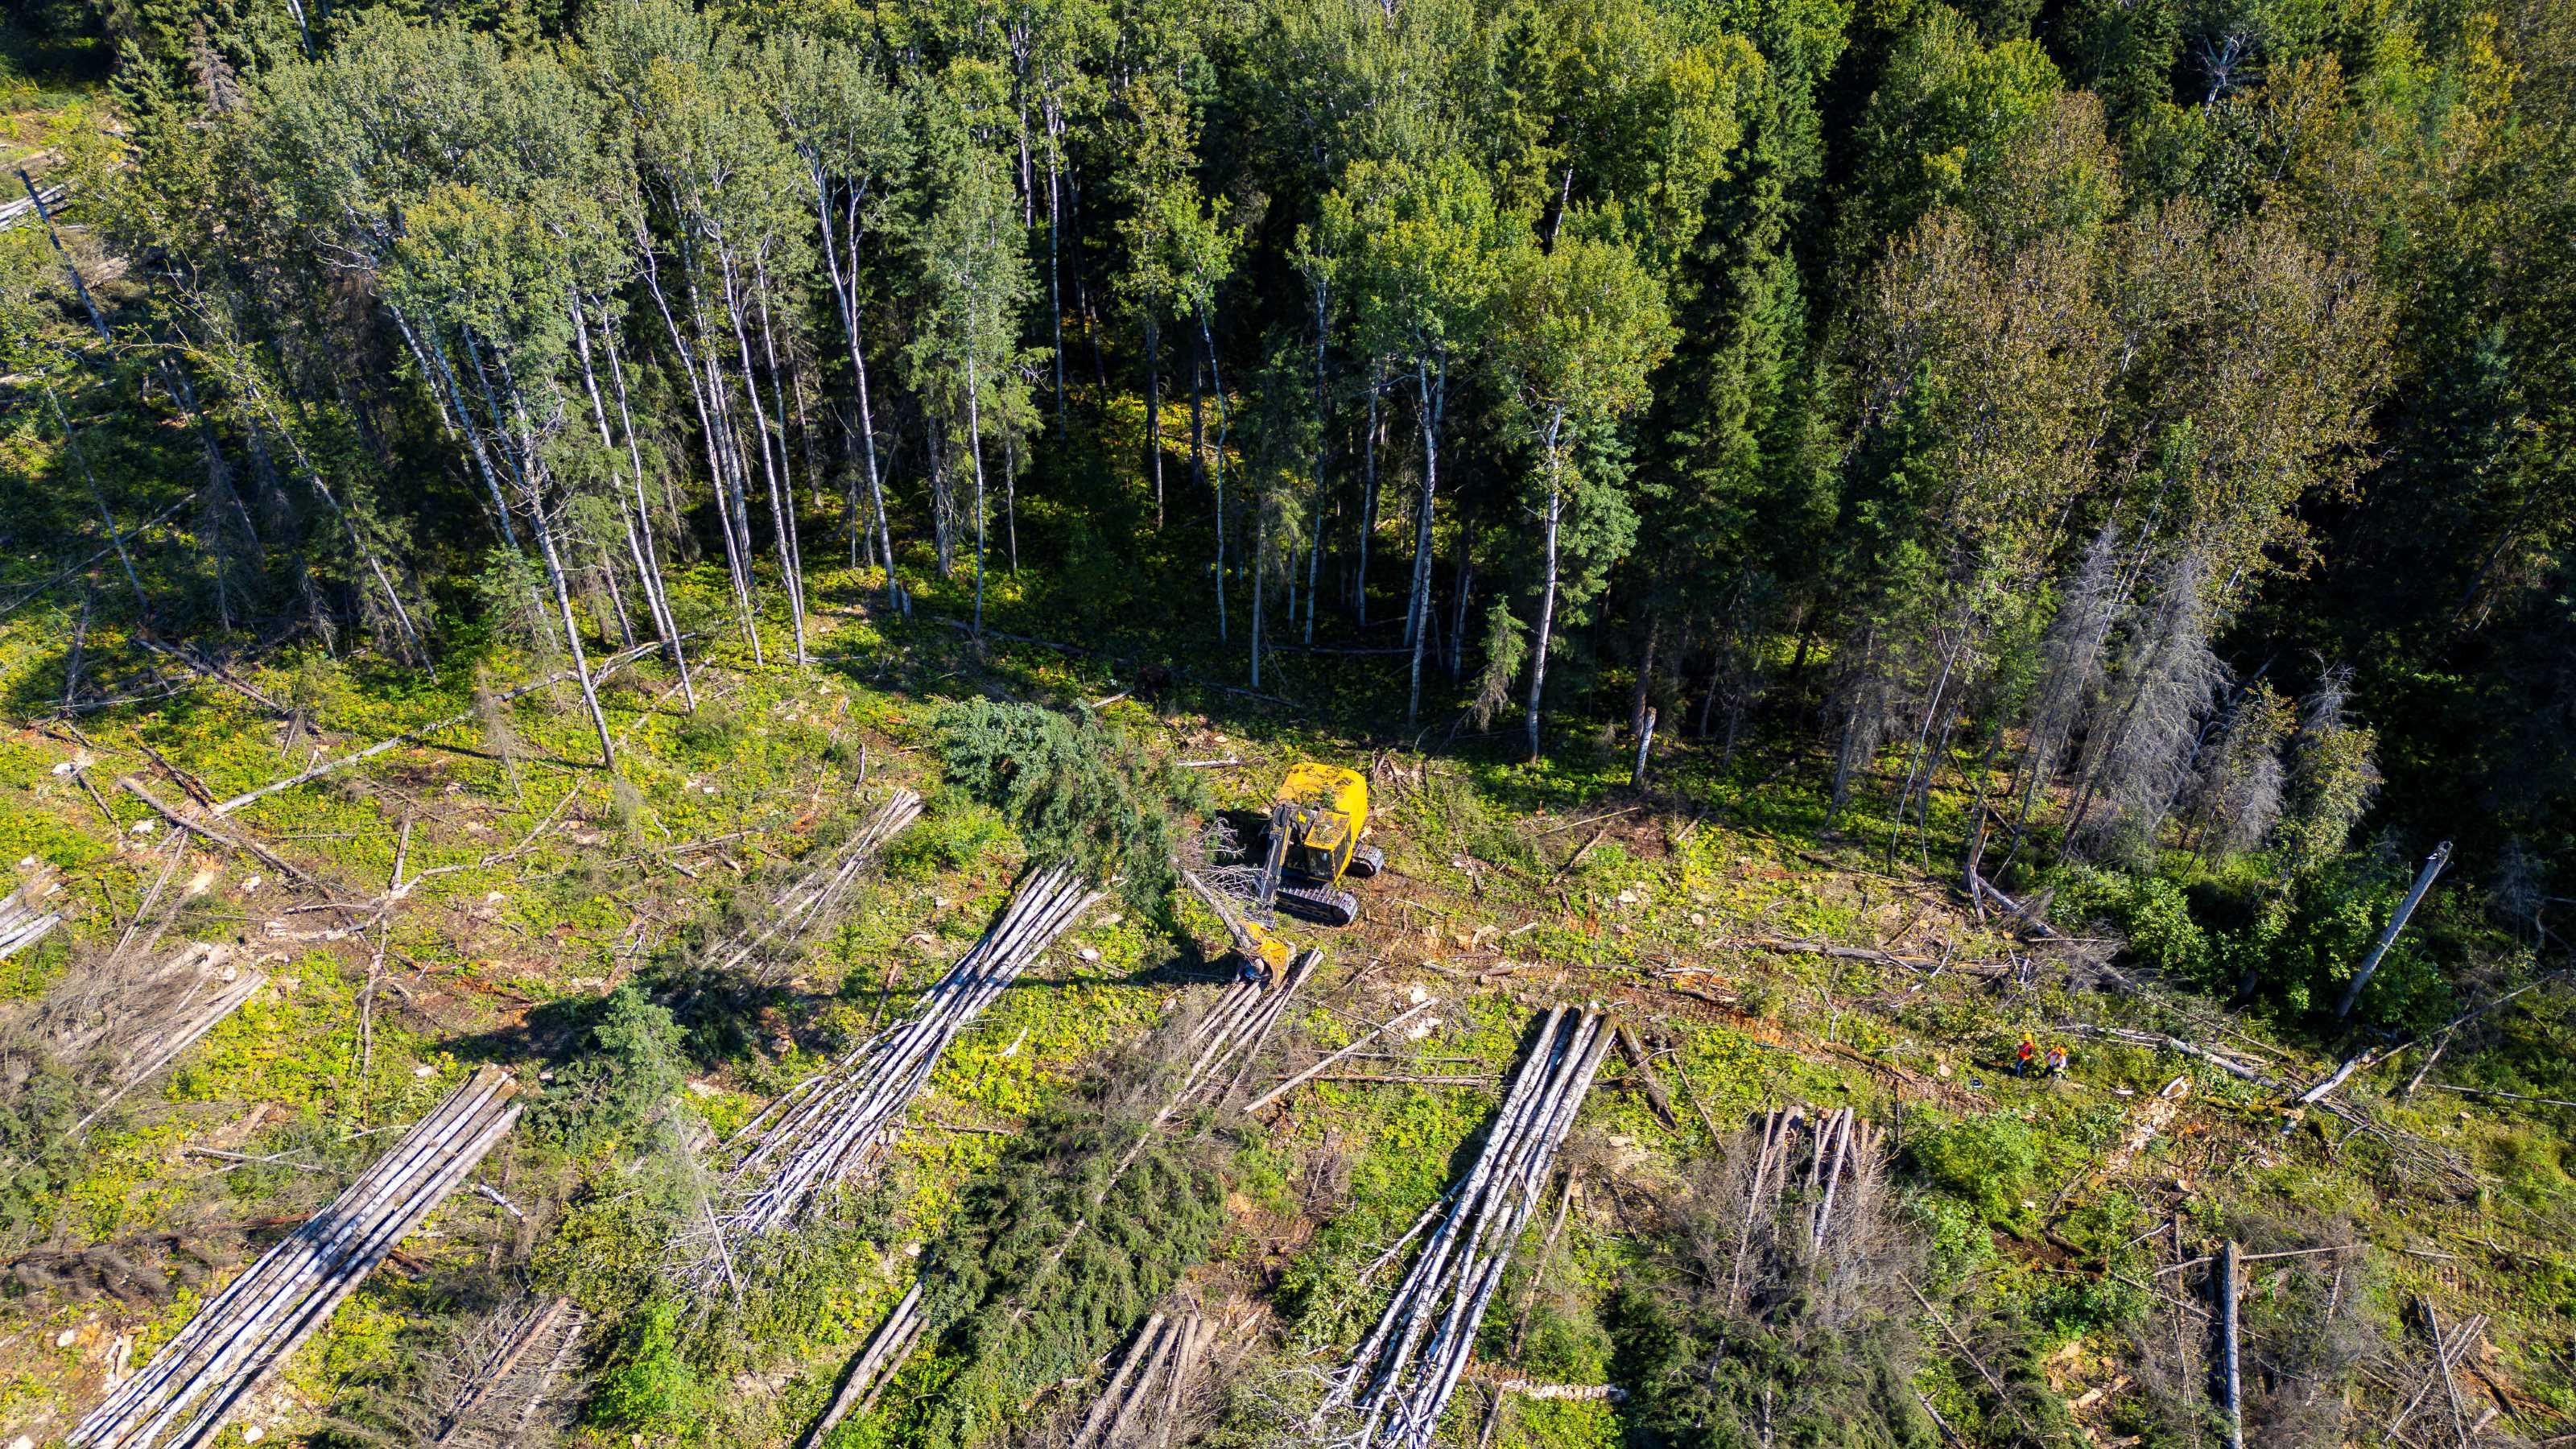
Forestry footprint is the most common footprint in the Al-Pac FMA area.
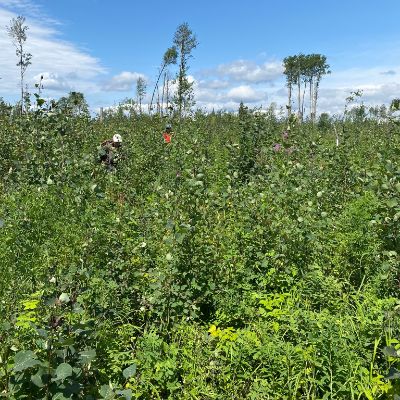
As trees regenerate after harvest, the forest recovers from the impacts of disturbance.
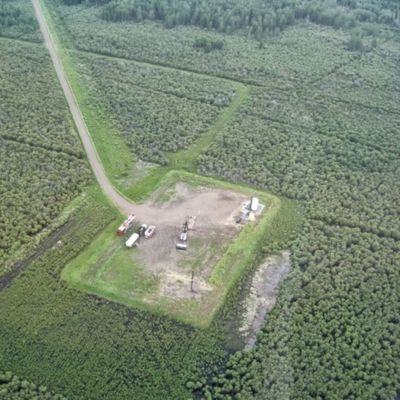
Energy footprint (e.g., well sites, seismic lines, and pipelines) is the second most common footprint type.
Results
(5,784 km2)

(3,708 km2)
(2,583 km2)

(1,554 km2)

(518 km2)
Highlights
- Forestry was the largest human footprint in the Al-Pac FMA area, covering 5.8% of the region; this number drops to 4.1% when ecological recovery of harvested areas is considered.
- After forestry, energy was the next most common human footprint, covering 2.4%.
- The remaining human footprint types each covered less than 1% of the region: transportation (0.5%), urban/rural/industrial (0.2%), human-created water bodies (0.1%), and agriculture (0.02%).
Status of Human Footprint. Map of human footprint categories in the Al-Pac FMA area circa 2023. Click on sectors in the legend to turn different footprint types on and off. Zoom in on the map for a detailed view of the distribution of human footprint.
View as Graph
Status of Human Footprint. Summary of per cent (%) area of human footprint broken down by category for the Al-Pac FMA area circa 2023. Total human footprint includes all categories other than Forestry, Net. Hover over the bar or legend to view the area of each footprint type. Total FMA area is 63,688 km2. Agriculture not shown due to its small area (0.02%) in the region.
View as Table
Status of Human Footprint. Summary of per cent (%) area of human footprint broken down by category for the Al-Pac FMA area circa 2023. Total FMA area is 63,688 km2. Total human footprint includes all categories other than Forestry, Net. Agriculture not shown due to its small area (0.02%) in the region.
Results
Annual rate of change: +3.2%
Annual rate of change: +3.1%
Annual rate of change: +2.0%
Annual rate of change: +3.7%
Annual rate of change: +3.3%
- In the Al-Pac FMA area, human footprint increased slowly between 1950 and 2000, rising by 4.3 percentage points (from 0.1% to 4.4%). More area was disturbed between 2000 and 2023, with human footprint increasing by 4.7 percentage points (from 4.4% to 9.1%), equivalent to an average increase of about 3.2% per year.
- Forestry footprint was negligible in 1950 but grew to cover 2.9% of the FMA area by 2000. Between 2000 and 2023, it increased by another 3.0 percentage points to 5.8% (excluding forest recovery), averaging about 3.1% growth per year. When accounting for the recovery of harvested areas, the net forestry footprint increased from 2.6% in 2000 to 4.1% in 2023, lowering the growth rate to 2.0% per year.
- Over time, recovered forestry footprint made up an increasing proportion of the total forestry footprint. In 2000, approximately 10% of the total forestry footprint had recovered, rising to 20% in 2010, and 29% in 2023.
- Energy footprint grew from a negligible amount to 1.1% between 1950 and 2000, then steadily increased to 2.4% by 2023—an average yearly growth of 3.7%. While forestry remains the largest contributor to new footprint, energy footprint grew at a slightly faster annual rate in recent decades.
- The remaining footprint types increased by only small amounts between 1950 and 2023.
View as Graph
Trend in Human Footprint. Trends in the percentage of total human footprint (grey) and by footprint category within the Al-Pac FMA area. Data are available for 1950, 1985, and 2000–2023 (excluding 2002–2003). Hover over categories in the legend to highlight the corresponding trend line. Hover over trend lines to see data values. Error bars represent 95% confidence intervals. Agriculture not shown due to its small area (0.02%) in the region.
View as Table
Trend in Human Footprint. The trend in the per cent (%) area of total human footprint and by human footprint category in the Al-Pac FMA area summarizing the changes from 1950–2023. Areas were calculated using full-precision data, and totals were rounded after to avoid rounding error. Agriculture not shown due to its small area (0.02%) in the region.
References
Newbold, T. et al. 2015. Global Effects of Land Use on Local Terrestrial Biodiversity. Nature 520(7545): 45–50. Available at: https://www.nature.com/articles/nature14324.
Alberta-Pacific Forest Industries Inc. 2022. Alberta-Pacific Forest Products Inc. Forest Management Agreement Area Forest Stewardship Report. Alberta-Pacific Forest Industries Inc. Available at: https://alpac.ca/wp-content/uploads/2021/06/Al-Pac-Stewardship-Report-2015-2020_complete_NCedit_21May21_final.pdf.
Shackelford, N., R.J. Standish, W. Ripple, B.M. Starzomski. 2018. Threats to Biodiversity from Cumulative Human Impacts in One of North America’s Last Wildlife Frontiers. Conservation Biology 32(3): 672–84. Available at: https://onlinelibrary.wiley.com/doi/abs/10.1111/cobi.13036.
Government of Alberta. 2012. Integrated Land Management Tools Compendium. Calgary: Environment and Sustainable Resource Development. Available at: https://open.alberta.ca/publications/9780778597568.
Government of Alberta. 2009. ILM Success Story: Al-Pac-Opti/Nexen Integrated Planning. Available at: https://open.alberta.ca/publications/ilm-success-story-alpac-opti-nexen-integrated-planning.
Government of Alberta. 2012. Lower Athabasca Regional Plan 2012-2022. Available at: https://open.alberta.ca/publications/athabasca.
Methods for summarizing human footprint are described in Section 1.3.2.
