Interior Native Habitat
Summary of the status (circa 2023) and trends (2010–2023) of interior native habitat in the Al-Pac FMA area at three buffer distances from human footprint: 50 m, 200 m, and 500 m.
.svg)
80.8% in 2010
54.2% in 2010
13.6% in 2010
- Interior native habitat declined across all distance categories from human footprint between 2010 and 2023.
- Losses were greatest in deeper interior areas (200–500 m and >500 m), particularly in White Spruce, mixedwood, and deciduous stands.
Methods for summarizing interior native habitat are found in Section 1.3.1.
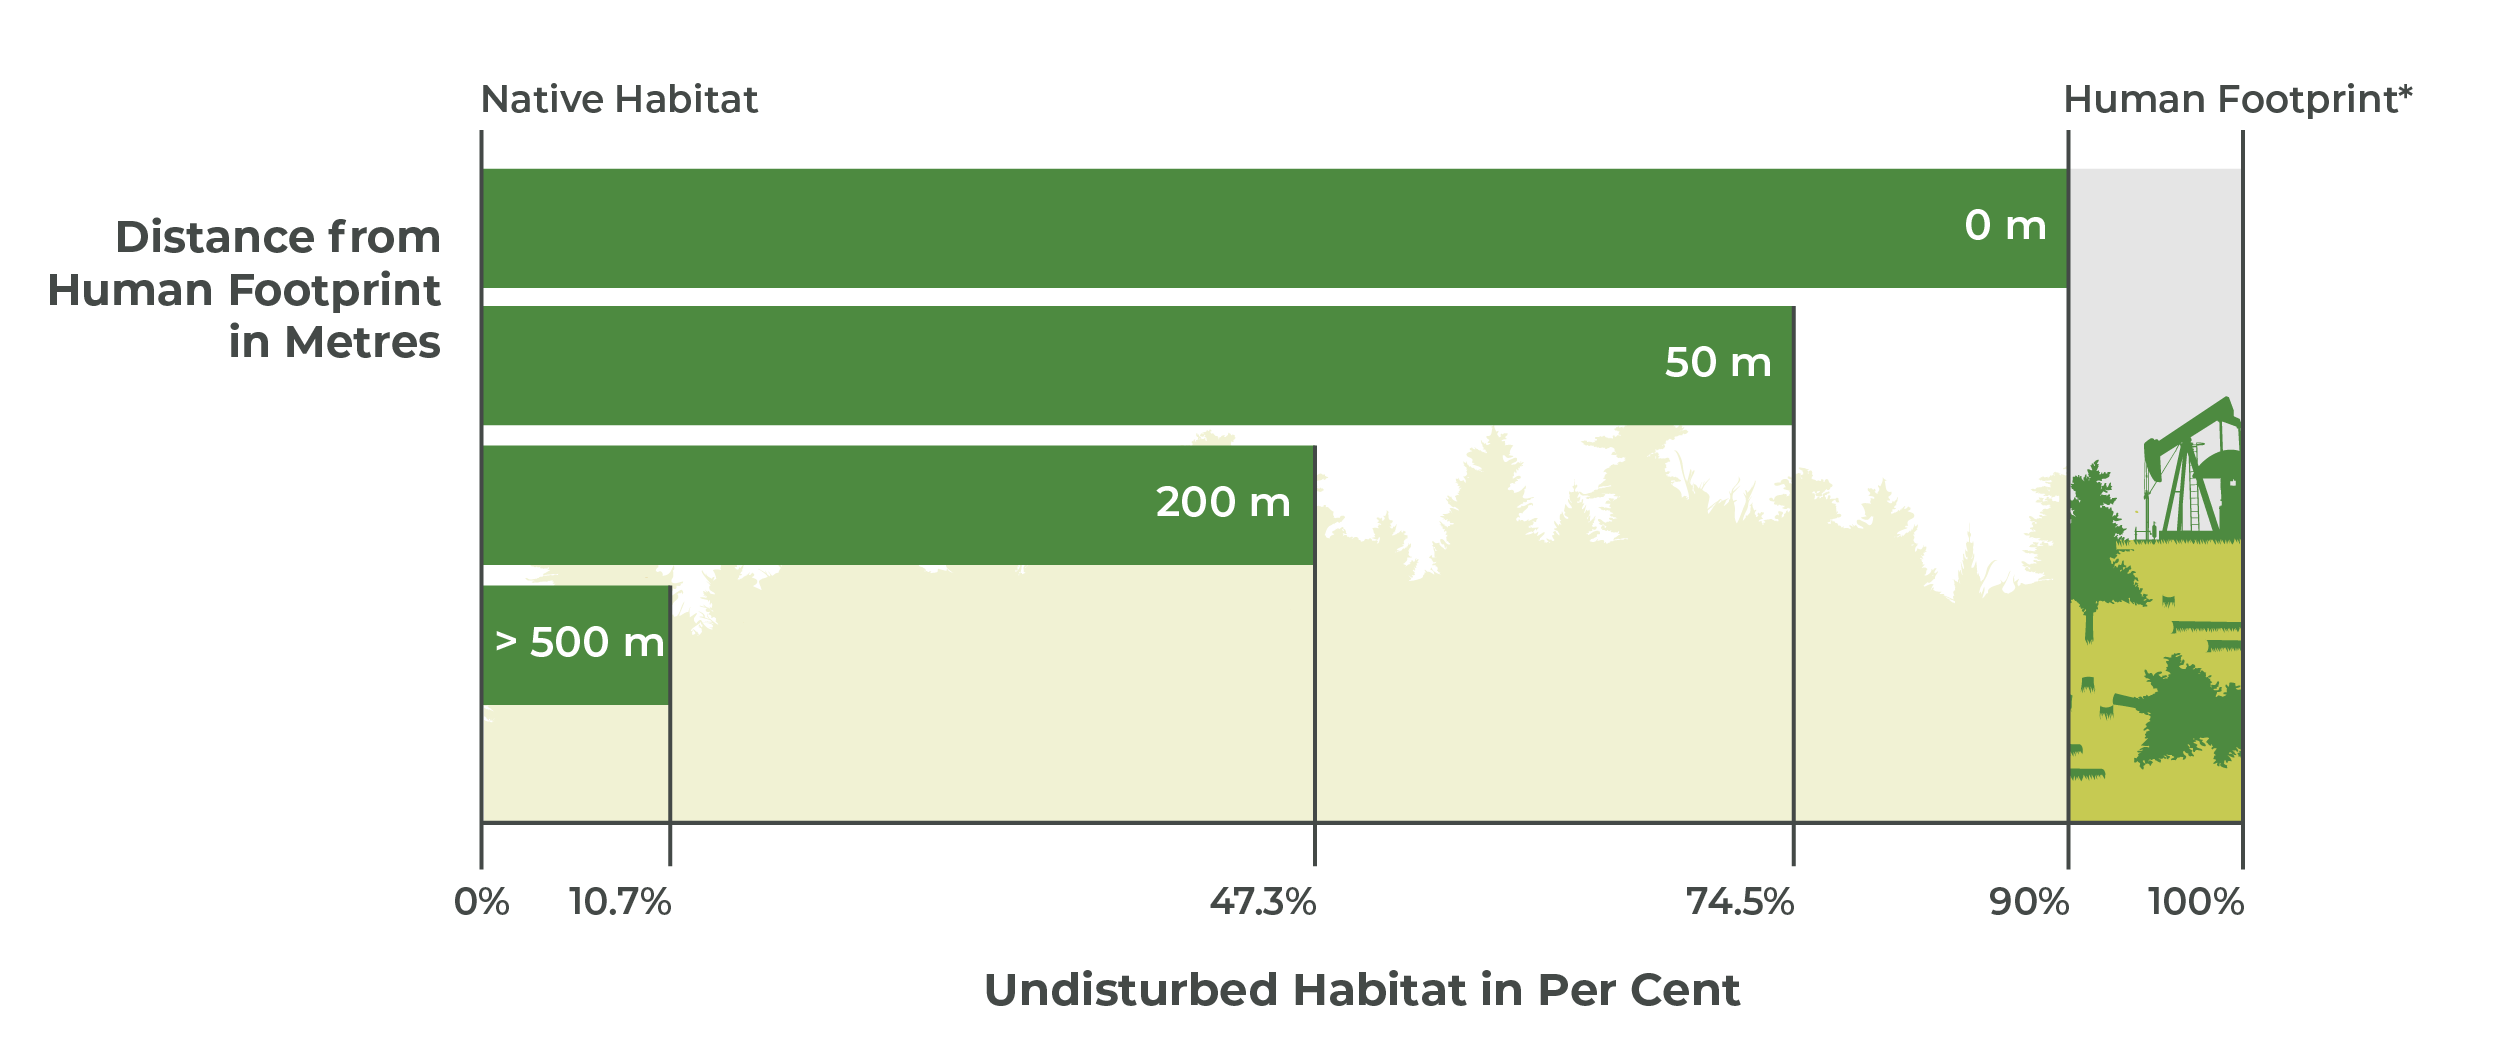
Native Habitat. Percent native habitat at four buffer distances from human footprint. Total undisturbed habitat shown for reference.
Note: Values differ slightly from Section 2.1 and Section 3.1 because open water and bare ground were excluded from the total area in the calculation of interior native habitat.
Introduction
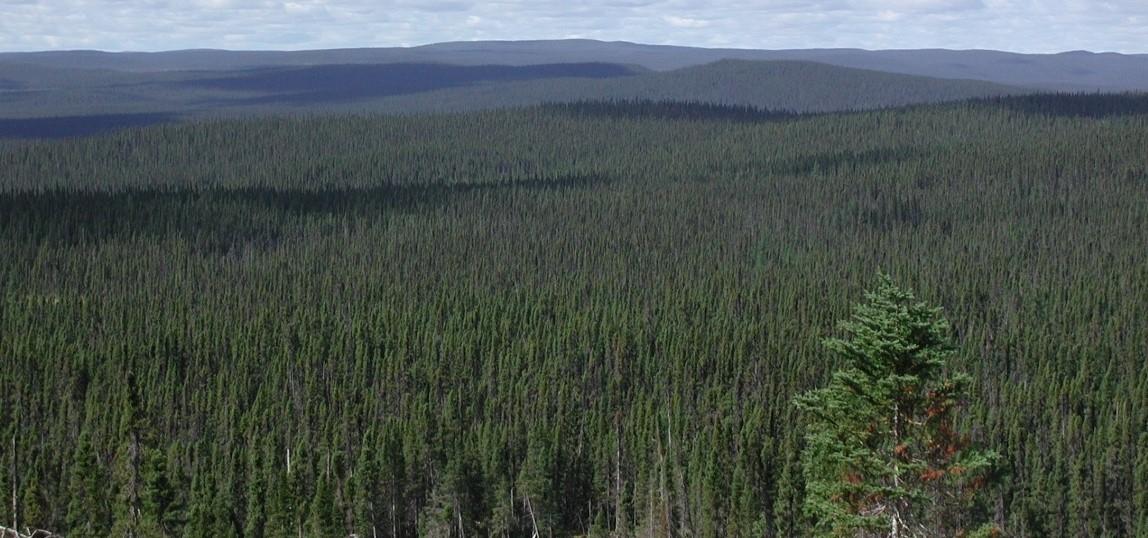
- These areas are crucial for maintaining ecosystem processes, enhancing resilience to disturbances and climate change, supporting wide-ranging and migratory species, and sustaining species sensitive to human activity[1,2].
- In the boreal forest, edge effects typically extend less than 50 m from human footprint but can reach 200 m or more depending on factors being measured[3]. Effects can include changes in microclimatic conditions (e.g., temperature, wind exposure), shifts in vegetation composition, increased predation or competition, the spread of invasive species, and exposure to noise, light, and air pollution[4].
- Areas beyond 500 m are generally free from direct disturbance, but may still receive contaminants carried over long distances, as well as broader impacts such as invasive species, changes in fire patterns, and increased recreational access.
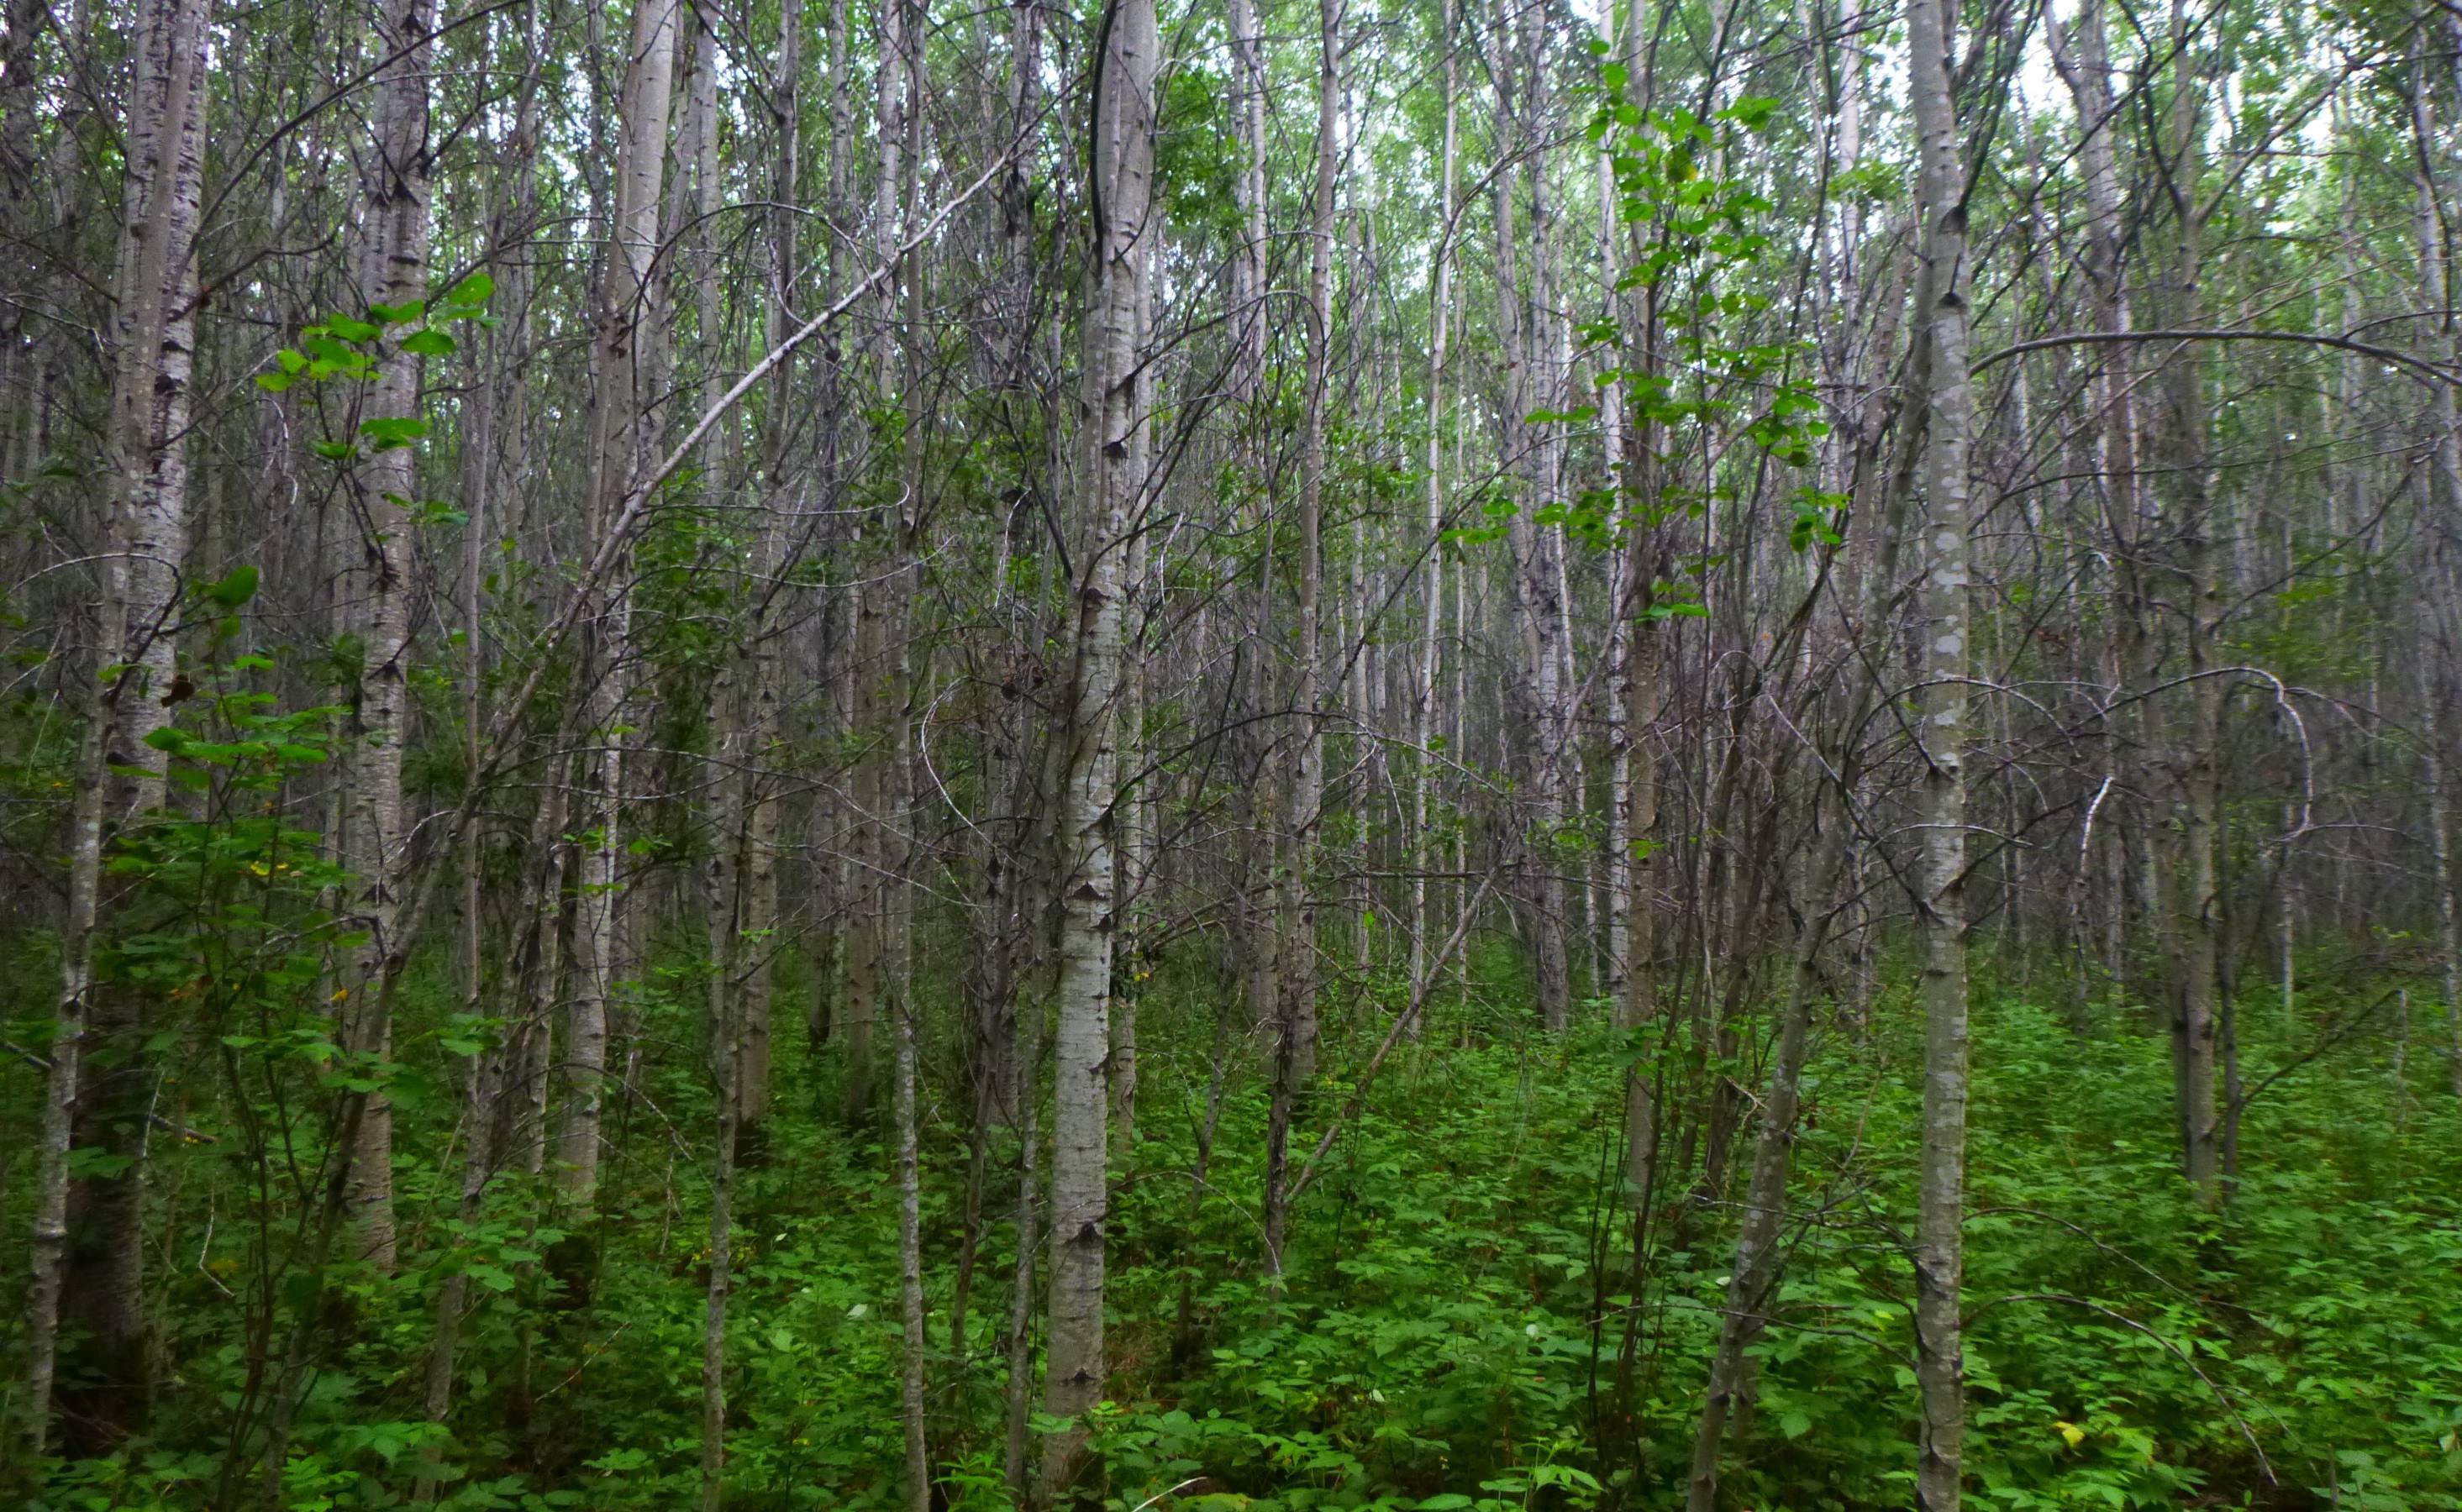
- Landscape changes that reduce interior native habitat can benefit species that thrive in regenerating harvested stands and along forest edges, such as White-tailed Deer[5] and Dark-eyed Junco. In contrast, many forest interior species—like Ovenbirds and Black-throated Green Warblers—prefer forests away from edges and are negatively affected by the loss of interior habitat.
- Within the FMA area, “old forest interior” is a stewardship indicator under Al-Pac’s approach to responsible forest management. As part of this framework, Al-Pac has committed to defining a target area of old interior forest for each cover class (deciduous, Pine, Black Spruce, mixedwood)[6,7].
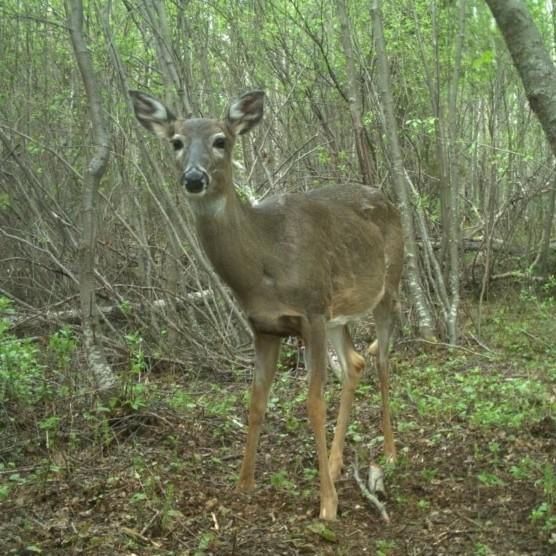

White-tailed Deer benefit from forest edges, where open areas provide abundant forage and nearby cover offers protection.
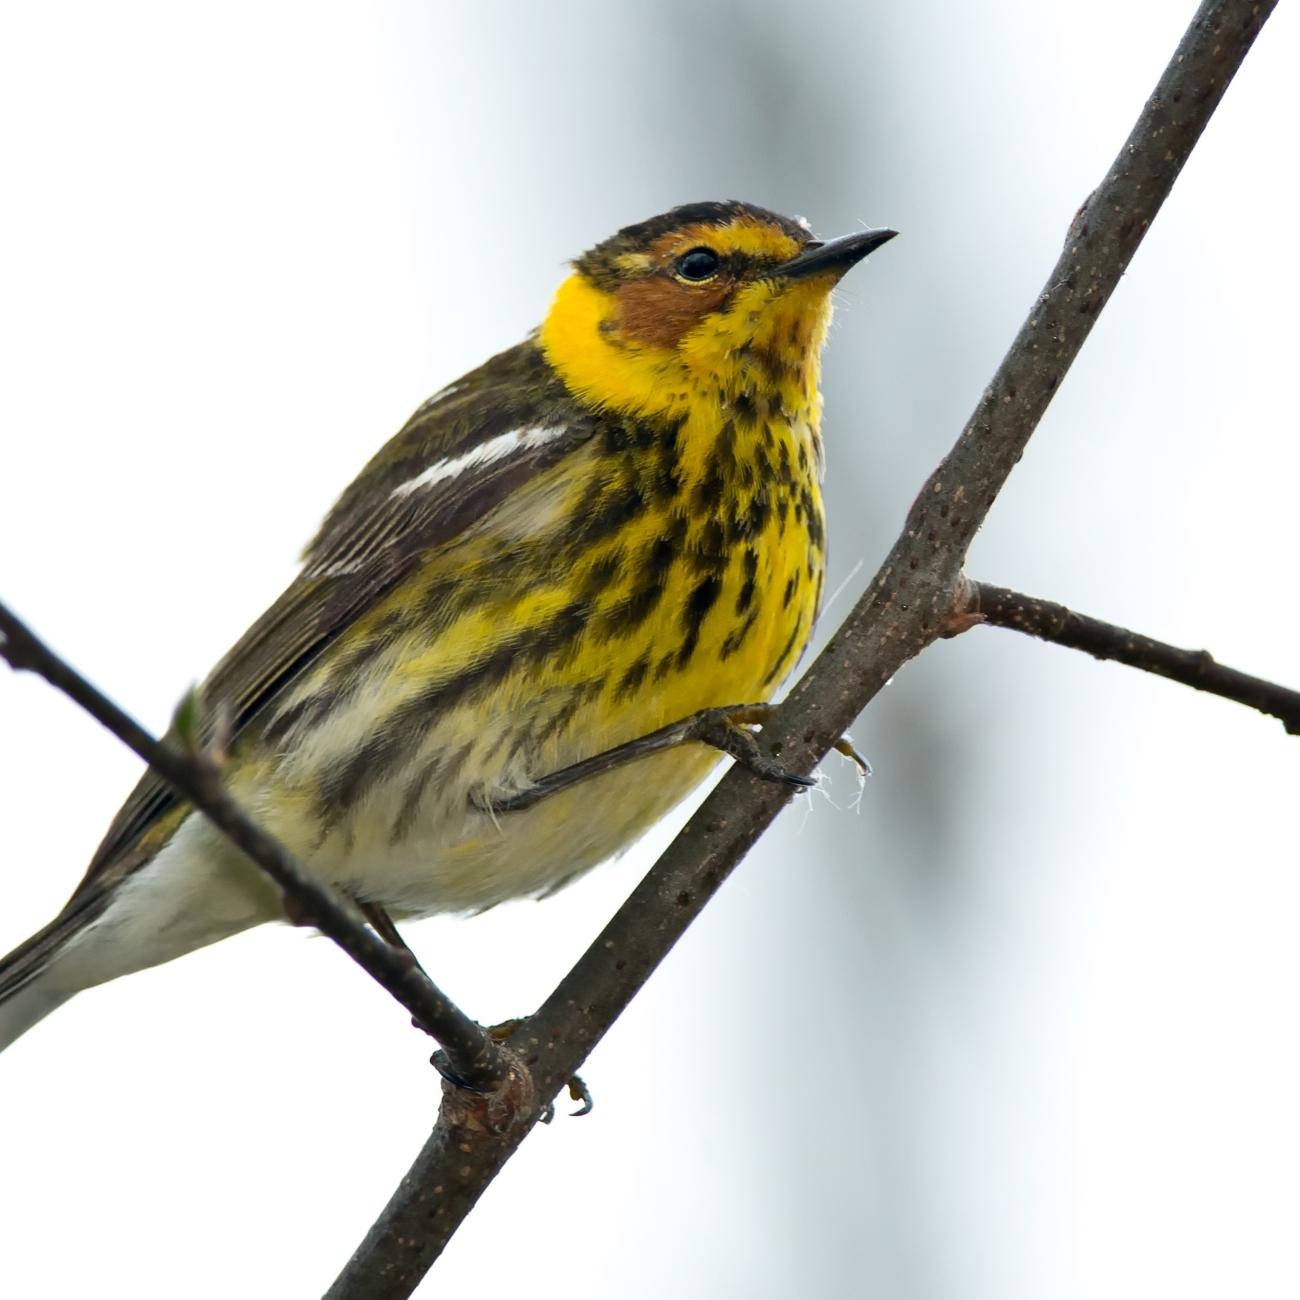
Old interior forest retention provides critical habitat for interior forest specialists, like the Cape May Warbler.
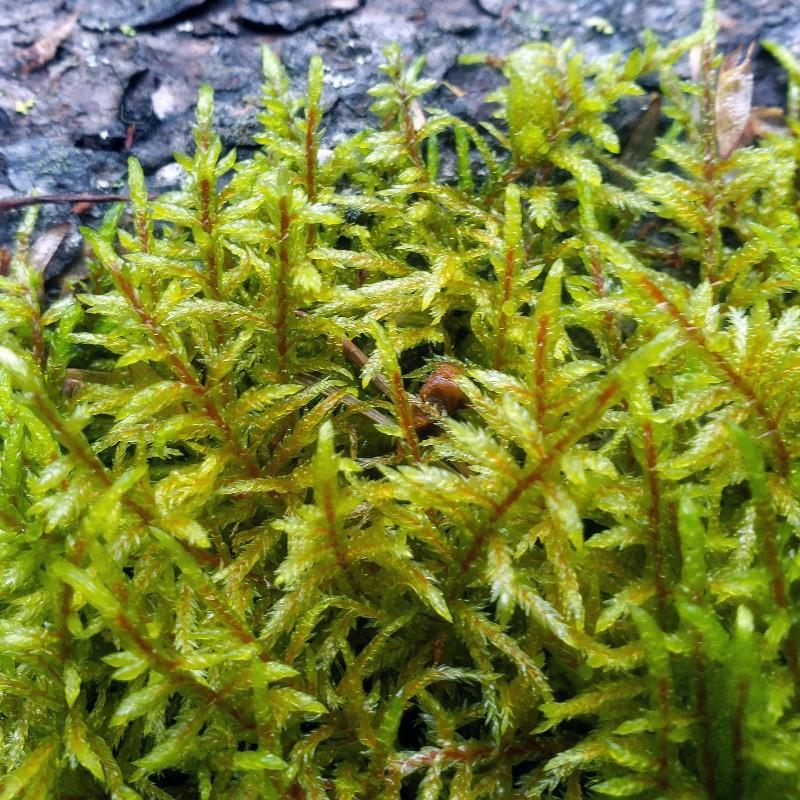
Red-stemmed Feather Moss prefers the cool, moist conditions of interior forests and declines along forest edges.
Results
Status of Interior Native Habitat
80.8% in 2010
54.2% in 2010
13.6% in 2010
Highlights
- About three quarters of the Al-Pac FMA area is interior native habitat at least 50 m from human footprint, decreasing to 47.3% at least 200 m from human footprint; 10.7% of interior native habitat is at least 500 m from human footprint.
- Human development activities occur throughout the Al-Pac FMA area. It is the distribution of this footprint, especially linear footprint, throughout the landscape that contributes to the fragmentation of native vegetation, reducing the area of interior native habitat.
Interior Native Habitat. Distribution of native habitat in the Al-Pac FMA area, circa 2023. Interior native habitat is buffered from human footprint using three edge distances (50 m, 200 m, 500 m), adjusted for successional recovery and linear feature width. Click the distances in the legend to toggle buffer layers on and off, and zoom in for a detailed view of interior habitat distribution.
Interior Native Habitat. Area of interior native vegetation in 2010 and 2023 in the Al-Pac FMA area. Native vegetation is buffered from human footprint at four edge distances (0 m, 50 m, 200 m, 500 m). Buffers around human footprint features were adjusted to account for successional recovery and the width of linear disturbances. Total undisturbed native vegetation (no buffer) is shown for reference.
Change in the Area of Interior Native Habitat: 2010–2023
The buffers of interior habitat are nested within each other (i.e., a 200 m buffer also includes the 500 m buffer) and the above section illustrates these nested patterns. In this section, the buffers are separated to examine changes for individual forest types at each distance category: 0-50 m, 50-200 m, 200-500 m, and >500 m. Results show total undisturbed habitat declined across all forest types from 2010–2023, but the rate of loss varied by buffer distance and forest type.
Change in Interior Native Habitat. Change in interior native habitat within the Al-Pac FMA area from 2010 to 2023, expressed as a percentage of the 2010 undisturbed vegetation area. Bars show the proportion of native vegetation within four distance categories from human footprint: 0–50 m (lightest green), 50–200 m, 200–500 m, and >500 m (darkest green). Hover over each bar segment to view the percentage of native vegetation in each distance class.
- Across all habitat types, interior native habitat decreased from 2010 to 2023, particularly in deeper buffer zones (>200 m from footprint).
- Losses were most pronounced in deeper interior categories (200–500 m and >500 m), indicating that interior native habitat that is distant from human footprint is getting smaller.
- Gains were mainly observed in the 0–50 m buffer. These shifts, paired with losses in deeper buffers, suggest that disturbances are encroaching into core areas resulting in more native habitat closer to edges. Some localized gains in these shallower buffers may also reflect forest recovery, such as regrowth along edges or revegetation of seismic lines.
- Upland forest types, including White Spruce, mixedwood, and deciduous showed the largest declines across all buffers, with less area remaining in deeper zones.
- However, Pine and lowland forests also experienced losses in core interior habitat. Although the annual rate of new disturbance in these forest types is relatively low (see Section 2.1), depending on how it is distributed, even a small amount of footprint can reduce the extent of interior habitat.
References
Potapov, P. et al. 2017. The Last Frontiers of Wilderness: Tracking Loss of Intact Forest Landscapes from 2000 to 2013. Science Advances 3(1): e1600821. Available at: https://www.science.org/doi/10.1126/sciadv.1600821.
Allan, J.R., O. Venter, J.E.M. Watson. 2017. Temporally Inter-Comparable Maps of Terrestrial Wilderness and the Last of the Wild. Scientific Data 4(1): 1–8. Available at: https://www.nature.com/articles/sdata2017187.
Franklin, C.M.A., K.A. Harper, M.J. Clarke. 2021. Trends in Studies of Edge Influence on Vegetation at Human-Created and Natural Forest Edges across Time and Space. Canadian Journal of Forest Research 51(2): 274–82. Available at: https://cdnsciencepub.com/doi/10.1139/cjfr-2020-0308.
Dabros, A., M. Pyper, G. Castilla. 2018. Seismic Lines in the Boreal and Arctic Ecosystems of North America: Environmental Impacts, Challenges, and Opportunities. Environmental Reviews 26(2): 214–29. Available at: http://www.nrcresearchpress.com/doi/10.1139/er-2017-0080.
Wittmer, H.U., B.N. Mclellan, R. Serrouya, C.D. Apps. 2007. Changes in Landscape Composition Influence the Decline of a Threatened Woodland Caribou Population. Journal of Animal Ecology 76(3): 568–79. Available at: https://onlinelibrary.wiley.com/doi/abs/10.1111/j.1365-2656.2007.01220.x.
Johnson, C.A., G.D. Sutherland, E. Neave, M. Leblond, P. Kirby, C. Superbie, P.D. McLoughlin. 2020. Science to Inform Policy: Linking Population Dynamics to Habitat for a Threatened Species in Canada. Journal of Applied Ecology 57(7): 1314–27. Available at: https://onlinelibrary.wiley.com/doi/abs/10.1111/1365-2664.13637.
Alberta-Pacific Forest Industries Inc. 2022. Alberta-Pacific Forest Products Inc. Forest Management Agreement Area Forest Stewardship Report. Alberta-Pacific Forest Industries Inc. Available at: https://alpac.ca/wp-content/uploads/2021/06/Al-Pac-Stewardship-Report-2015-2020_complete_NCedit_21May21_final.pdf.
Methods for summarizing interior native habitat are found in Section 1.3.1.
