Methods: Land Base Change Indicators
Summary of methods for defining land base change indicators, analyzing data, and summarizing results.
.svg)
Human Footprint
The ABMI defines human footprint as the visible alteration or conversion of native ecosystems to temporary or permanent residential, recreational, agricultural, or industrial landscapes. The definition includes all areas under human use that have lost their natural cover for extended periods of time, such as cities, roads, agricultural fields, and surface mines. It also includes land that is periodically reset to earlier successional conditions by industrial activities such as forest harvest areas and seismic lines.
Some human land uses, such as grazing, hunting, and trapping, or the effects of pollution, are not yet accounted for in our human footprint analyses. The ABMI is continuously working to improve human footprint products, using the reference data and expertise of authorities within the Government of Alberta
Human footprint is divided into eight categories for analysis:


The ABMI monitors the status of Alberta’s human footprint using satellite imagery at two spatial scales: provincial scale and 3×7-km sample scale.
At the provincial scale, the ABMI merges 20 human footprint sub-layers (based on 117 feature types) into a single integrated layer by applying a specific order of precedence to create the ABMI Human Footprint Inventory (HFI)[1]. Some of these 20 sub-layers are created by the ABMI and Government of Alberta as part of the Alberta Human Footprint Monitoring Program[2]. We used the HFI for 2010 and 2023 conditions in this report.
In this report, we use the HFI 2023 to:
- report on the current status of human footprint;
- standardize the 3×7-km trend estimates before reporting;
- as part of the analysis of biodiversity intactness and sector effects to identify how the occurrence and relative abundance of species varies in relation to native land cover, human footprint, and spatial/climate variables, and;
- generate maps of human footprint in the Al-Pac FMA area.
We use HFI 2010 and HFI 2023 as part of the land base change analyses, reporting on changes in several land cover indicators between 2010 and 2023, as well as species responses to those changes, including:
- 2.2 Native Cover: Status & Trend
- 2.3 Interior Native Habitat: Status & Trend
- 2.4 Landscape Connectivity: Status & Trend
- 3.2 Landbase Change from 2010 to 2023
- 4.3 Effects of Land Base Change on Habitat Suitability
This product is updated approximately every two years. HFI data and metadata are available in ABMI's Open Data Portal.
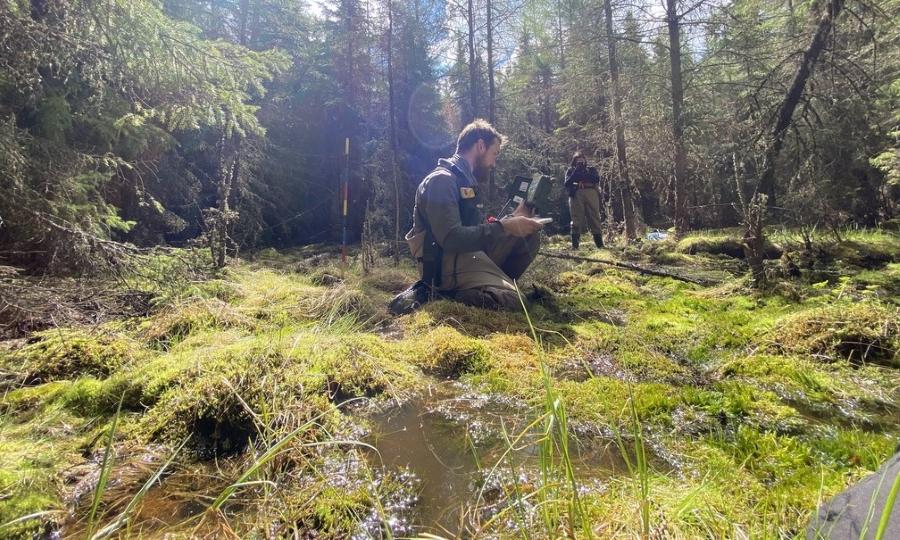
The ABMI uses human footprint data measured annually at a 1:5,000 scale to track changes in human footprint over time. Detailed annual samples of human footprint are measured in a 3×7-km rectangular area centred near each of the ABMI’s 1,656 sites, which when summed across all sites amounts to about 5% of the province’s land surface. ABMI human footprint trend data are available for 1950, 1985, 2000, 2001, and 2004 to 2023.
As we do not have provincial coverage of human footprint for these intermediary years, we estimate a confidence interval for our estimates of trend. Confidence intervals are calculated as follows:
- For the reporting region of interest, identify all 3×7 areas whose centroid falls within the focal region.
- Using this subset of 3×7 areas, randomly resample, with replacement, 200 of the 3×7.
- Based on this resample, estimate the 5%, 50%, and 95% quantiles to represent uncertainty.
- Repeat steps 2 and 3 for each year used in trend reporting.
- Once all results are created, standardize the results based on the most recent provincial HFI inventory. This means for the final year of trend estimates, we no longer present a confidence interval as we have the observed provincial human footprint.
Trend data and the metadata associated with this can be accessed in ABMI's Temporal Human Footprint page.
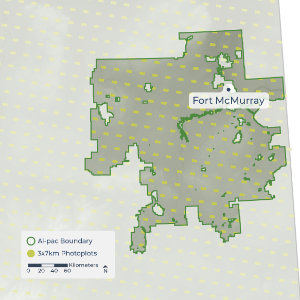

Sampling Sites. Distribution of ABMI 3x7-km detailed annual sampling sites in the Al-Pac FMA area.
As a successional footprint, forestry recovers with time after disturbance. To account for this recovery, we summarize “recovered forestry”—defined as "Forestry, Net" in this report—prorating the effects on biodiversity of older harvested areas using biotic recovery curves based on a literature review of the recovery of forest species in harvest areas of different ages[3]. A newly harvested area is considered to be 0% recovered, while a mature/old forest (80 years old) is 100% recovered. Field studies of the abundance of species in harvest areas of different ages were used to fill in the recovery curve between those two benchmarks. Because results show faster recovery in deciduous forest than in conifer forest, we apply different recovery curves for these two forest types. More information on the curves used is available in the ABMI’s Status of Human Footprint in Alberta[4] report. We do not yet have information on recovery of other types of human footprint.
To report on the status and trend of human footprint (Section 3.1), the ABMI presents the percentage of land directly altered by human activities, ranging from 0% (no visible human footprint) to 100% (completely modified by human footprint). In general, cities and cultivated fields have high human footprint, while protected and undeveloped areas have low human footprint. We summarize total human footprint and the seven reporting categories.
Trend in human footprint in Al-Pac’s FMA area was assessed using the 3×7-km detailed inventory of human footprint available for: 1950, 1985, 2000, 2001, 2004–2023. Trend is presented for total human footprint and the seven reporting categories. The maps used to visualize human footprint in this report are based on the HFI 2023 (described above).
We calculated annual rate of change in human footprint types from 2000-2023. There are multiple approaches for defining the annual rate of change. For the information presented here, we used the methods defined by the Food and Agriculture Organization of the United Nations[5].
Annual rate of change = (A1 - A2) 1 / (t2 - t1) - 1
Where A1 and A2 represent the area at the time points at t1 and t2.
Land Base Changes
To summarize land base changes between 2010 and 2021, the 2010 and 2021 wall-to-wall vegetation and human footprint maps were intersected, and transitions of land base cover types were summarized. Six causes of change are distinguished:
- Aging of native forest that is undisturbed over that span,
- Aging of harvest areas that existed in the first year,
- Fires,
- New forestry footprint,
- New non-forestry human footprint replacing native habitat and harvest areas, and
- Changes in non-forestry human footprint that existed in the first year.
Currently only undisturbed forest stands and forestry footprint age in the land base summaries. Other human footprint continues to exist unchanged unless it is replaced by a different type of human footprint; as a result, component 6 is always small.
Broad vegetation types (stand types combining all age classes, open vegetation types) can be affected by fire, new forestry footprint, and new non-forestry footprint. Aging of undisturbed vegetation does not need to be reported for these broad types—any stand that was not disturbed necessarily aged 13 years in the 2010 to 2023 time span. We do not “retire” human footprint, and back-filled vegetation types do not change, so there is no way that any area can be recruited into these broad vegetation types.
Figures in Section 3.2 show the areas of the three disturbance types and the area that remained undisturbed for each vegetation type. Results are presented as raw areas, and also as percentages of the 2010 area of each vegetation type
Old stands can also be impacted by fire, new forestry human footprint, and new non-forestry human footprint. Unlike the ageless broad vegetation types above, old forest can also recruit as undisturbed stands cross the “old” age threshold. These processes are summarized for old stands (100+ years) in the four upland stand types (deciduous, mixedwood, pine, White Spruce).
Figures in Section 3.2 show the area of old forest of each stand type lost to the three disturbance processes and the area recruited due to aging of undisturbed stands. Results are also presented as a percentage of the 2010 area of each old forest type.
Linear Features
Linear features are analyzed using polylines (lines centered on the width of the line). Some linear features, such as low-impact seismic lines, are not included. Linear feature types are divided into the following categories for reporting:


Linear features are summarized by total length (km) and density (km/km2) in the FMA area. Two versions of linear density calculations are reported for the polylines of each linear sublayer.
- Total density calculations use the total linear kilometers of the sublayer or feature type.
- Integrated density calculations are based on the integrated HFI dataset. The integrated HFI dataset removes overlap with the sublayers that are higher on the integration hierarchy (i.e., order of precedence) (Alberta Biodiversity Monitoring Institute and Alberta Human Footprint Monitoring Program. ABMI Human Footprint Inventory (HFI) for Alberta 2022 (version 1.0). Geodatabase. Last modified March 31, 2025. Table 1, p14). For this integrated calculation, polylines of the linear features were removed where they overlapped polygons that were higher on the integration hierarchy. For example, features in o3_Roads were removed where they overlap with o1_Reservoirs and o2_BPDSL polygons. Features in o20_SeismicLines_and_Trails are at the bottom of the hierarchy and were removed when they overlap any of the polygons from the other 19 sublayers.
The ABMI is continuously working to improve linear footprint products, using the reference data and expertise of authorities with the Government of Alberta. HFI data and metadata are available in ABMI's Open Data Portal.
See Section 3.3 for linear features results.
References
Alberta Biodiversity Monitoring Institute (ABMI). 2022. The Human Footprint Inventory (HFI) 2019. Available at: https://abmi.ca/publication/611.html.
Alberta Environment and Parks. 2019. Alberta Human Footprint Monitoring Program (AHFMP) - Footprint Sublayers - Circa 2014 & 2016. Available at: https://open.alberta.ca/opendata/gda-5dcc68a1-154a-47ac-ae05-e822b17bb364.
Huggard, D., L. Kremsater. 2015. Human Footprint Recovery for the Biodiversity Monitoring Framework—Quantitative Synthesis. Unpublished Report.
Alberta Biodiversity Monitoring Institute (ABMI). 2023. The Status of Human Footprint in Alberta (Online Report). Available at: http://abmi.ca/publication/675.
FAO. 1995. Forest Resources Assessment 1990: Global Synthesis. FAO forestry Paper 124: 1–44.
Alberta Environment and Parks. 2025. Crown Land Trails. Available at: https://open.alberta.ca/opendata/gda-a80344fd-8510-4607-8959-ab1fd3724d70.
