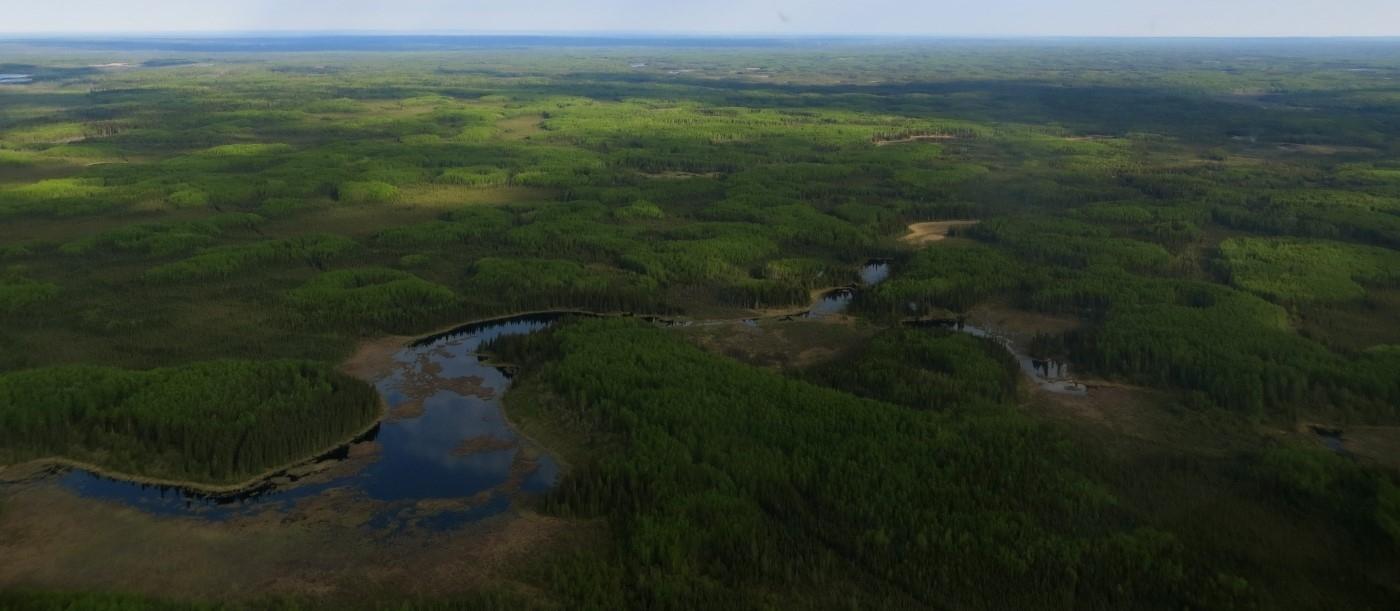
Native Vegetation
Summary of native vegetation status (2023) and trend (1950-2023) in the Al-Pac FMA area.
.svg)
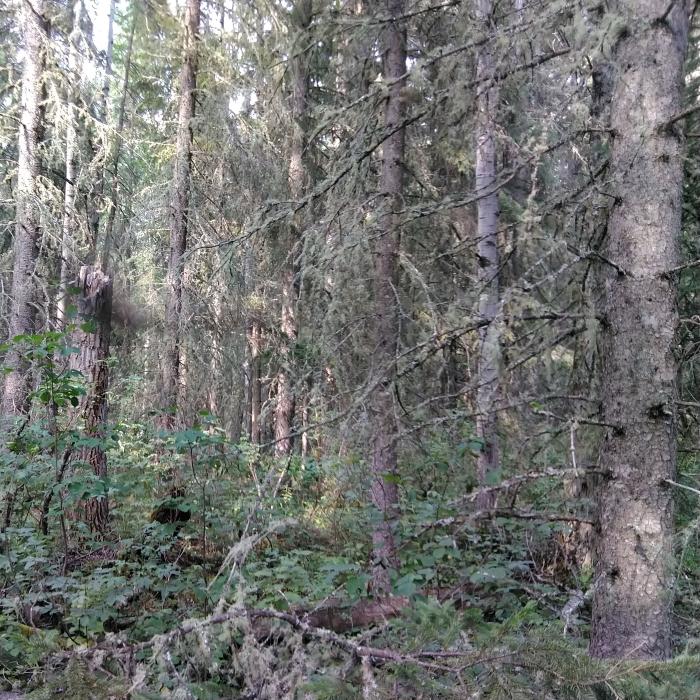
- Undisturbed upland forests, including deciduous, mixedwood and coniferous forest types (where most harvesting occurs), occupy just over 30% of the land base.
- Deciduous forest was the most affected by disturbance, declining by 2.3 percentage points since 2000.
- Among forests more than 100 years old, deciduous and Pine stands increased, mixedwood stands remained stable, and White Spruce stands declined in extent between 2000 and 2023.
Methods for summarizing undisturbed native vegetation are described in Section 1.3.1.

Introduction
- Documenting and mapping vegetation types is critical to understanding how human activity, including forestry, impacts ecosystems by tracking habitat loss, fragmentation, and shifts in vegetation composition.
- Coarse filter monitoring of native vegetation complements “fine filter” monitoring of species by providing detailed information on habitat changes—a main driver of species population changes—and supports responsible, evidence-based land-use decisions (e.g., forest management planning).
- A key objective in Al-Pac’s approach to forest management is to maintain the distribution of forest types and age classes within the natural range of variation, reflecting historical patterns shaped by wildfires and other natural disturbances.
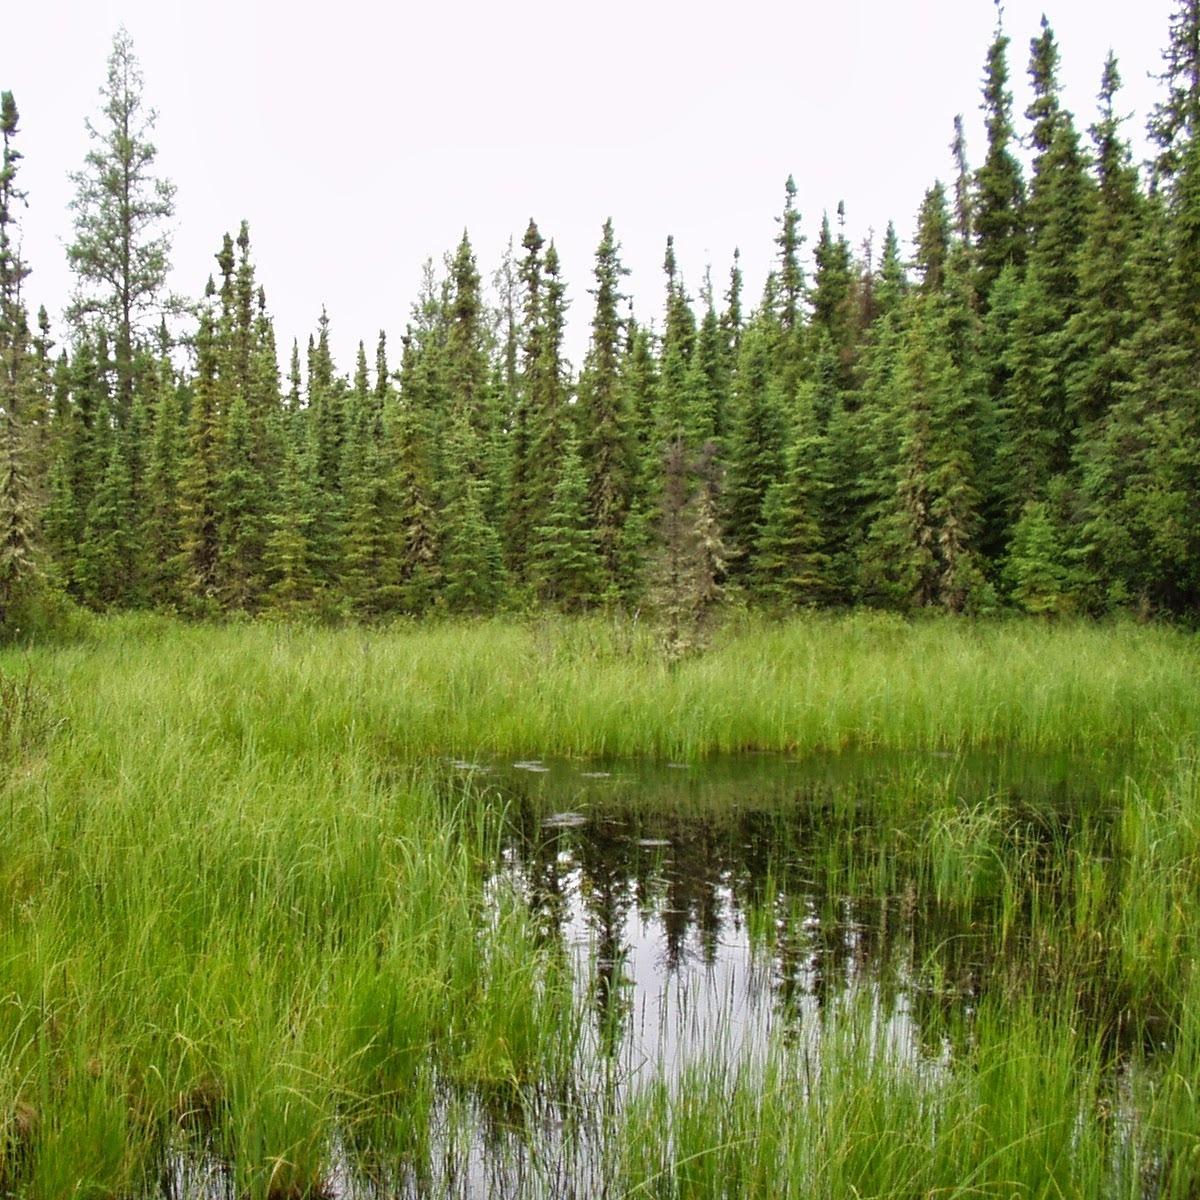
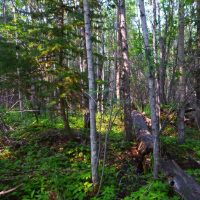
Lowland vegetation types, including Black Spruce and treed fens, cover about half of the Al-Pac FMA area.
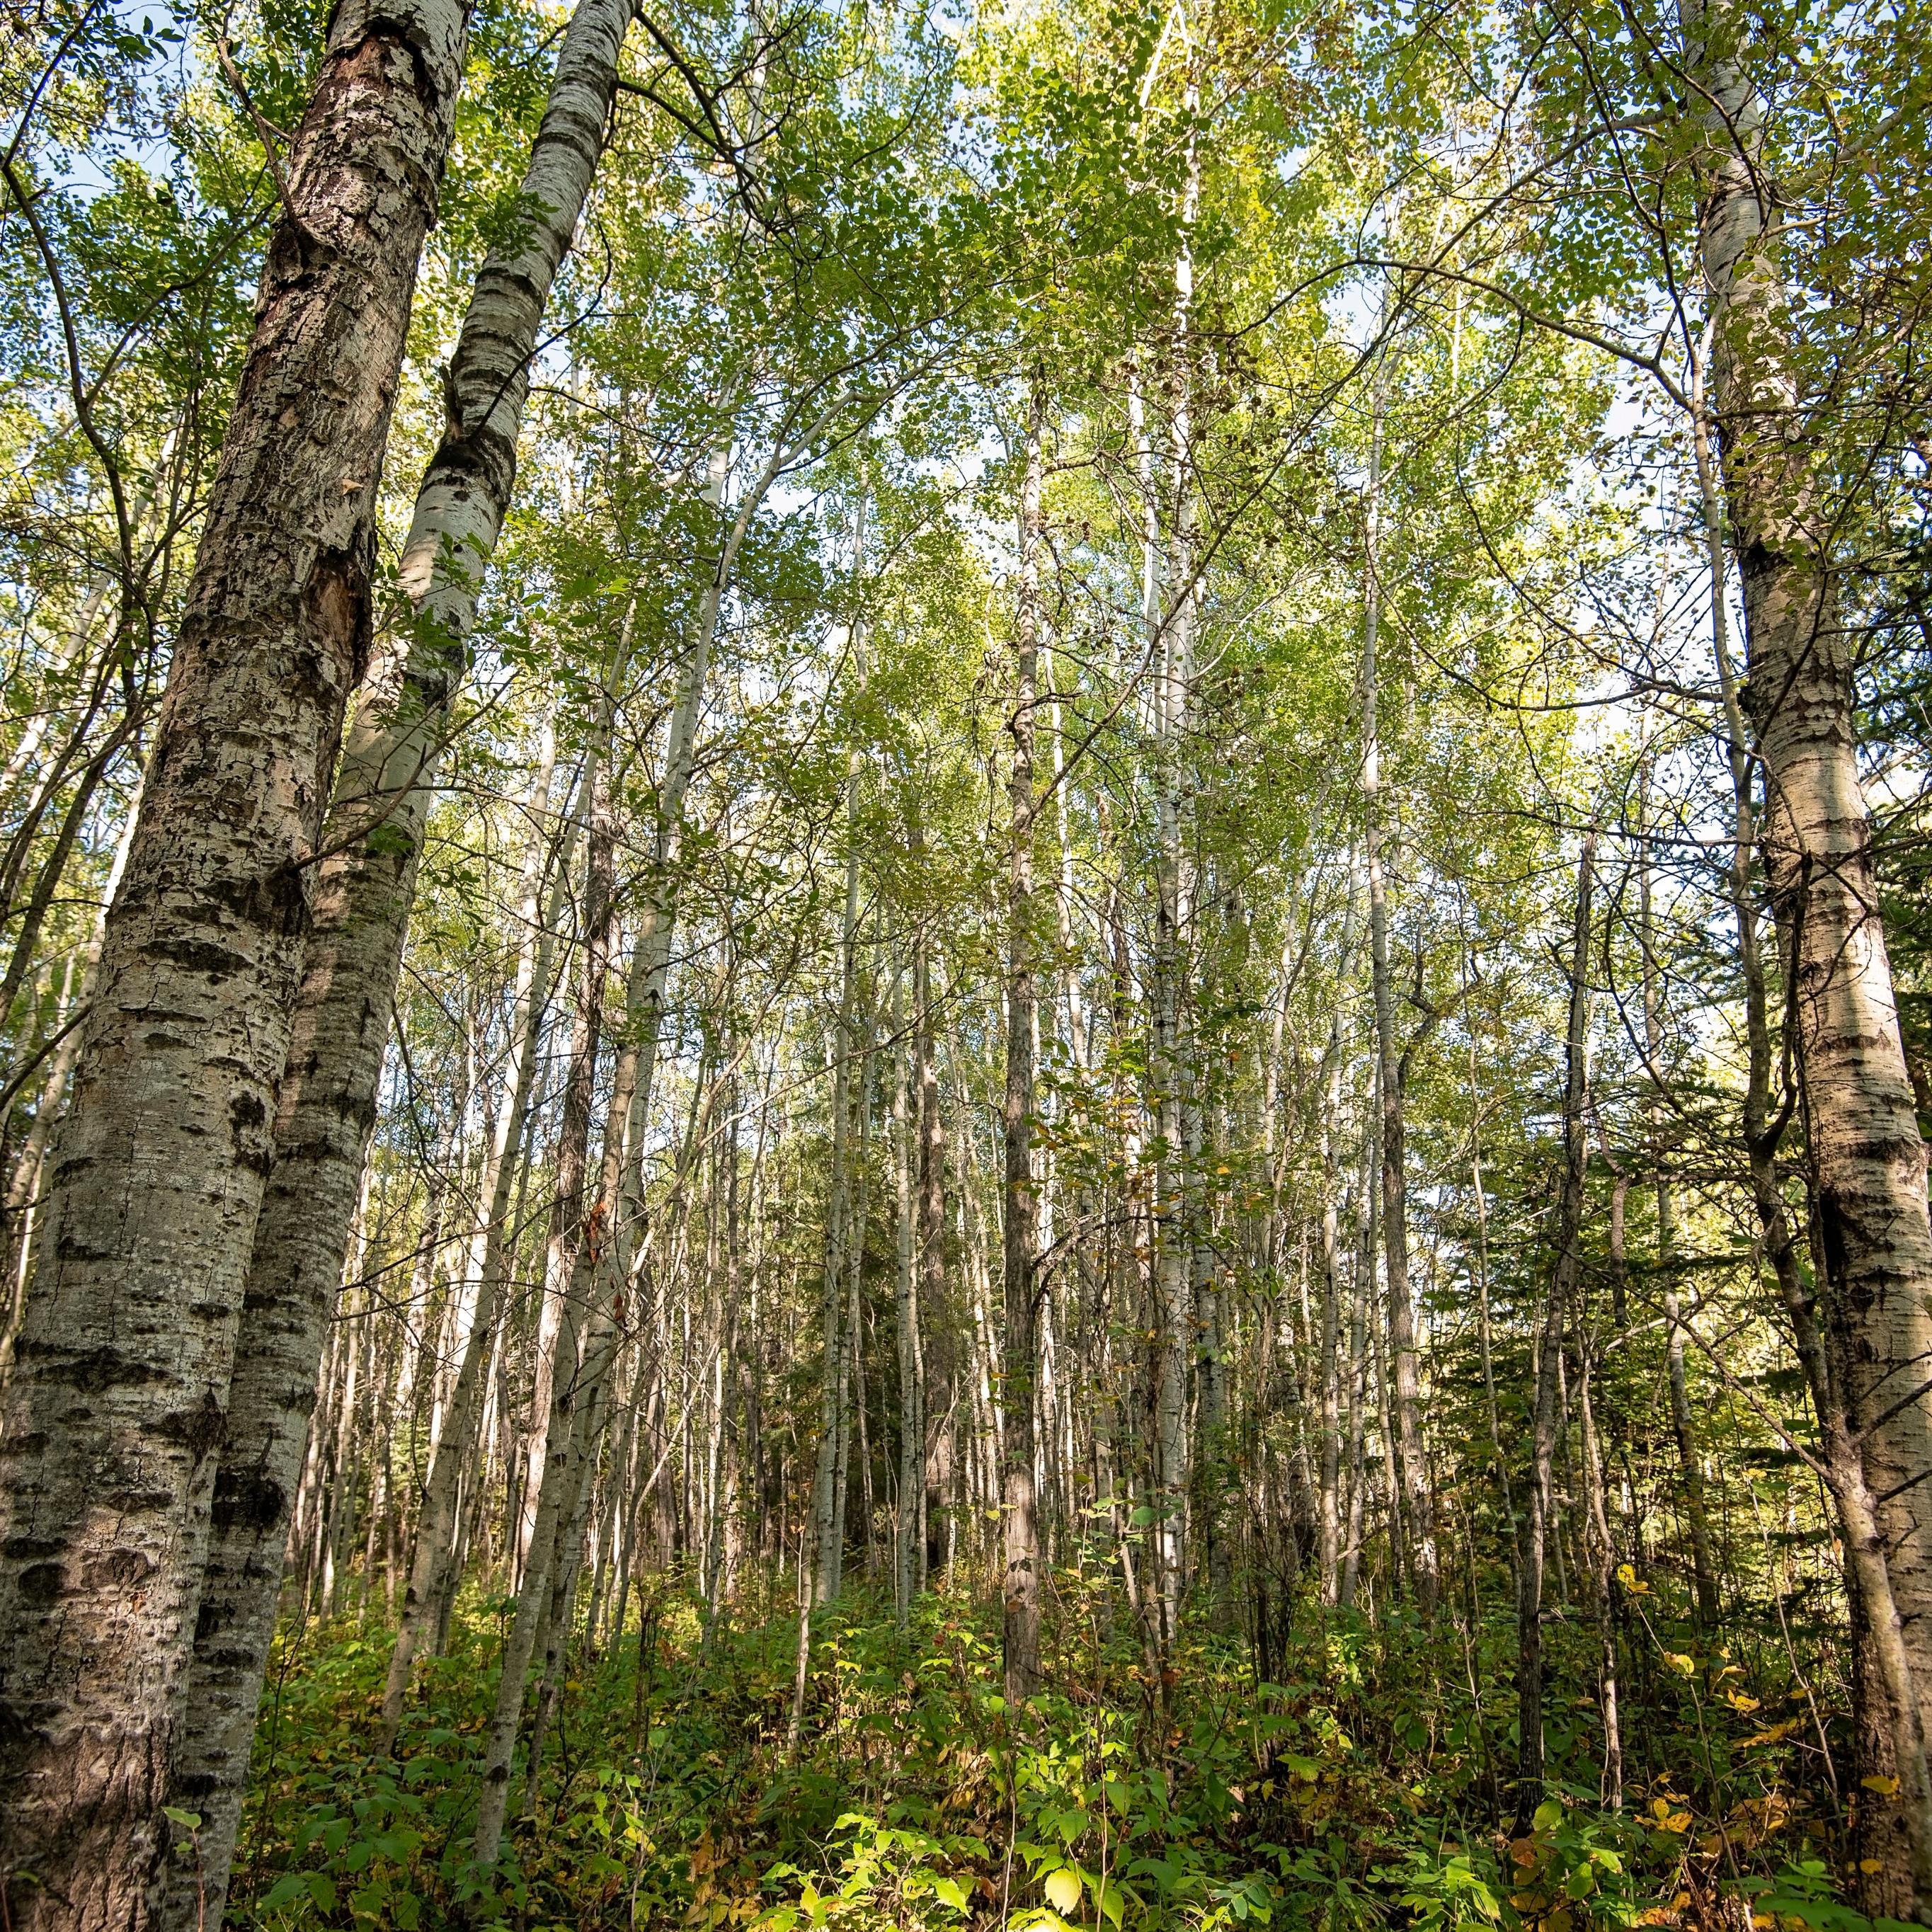
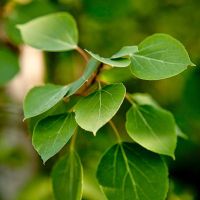
Deciduous and mixedwood upland stand types cover about 20% of the FMA area.
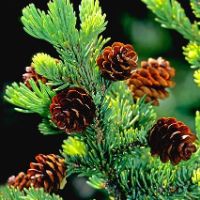
Upland coniferous forests, including Pine and White Spruce stands, covers about 10% of the FMA area.
Results
Status of Native Vegetation
The area of undisturbed native vegetation in the Al-Pac FMA area (circa 2023) was:
93.1% in 2010
Highlights
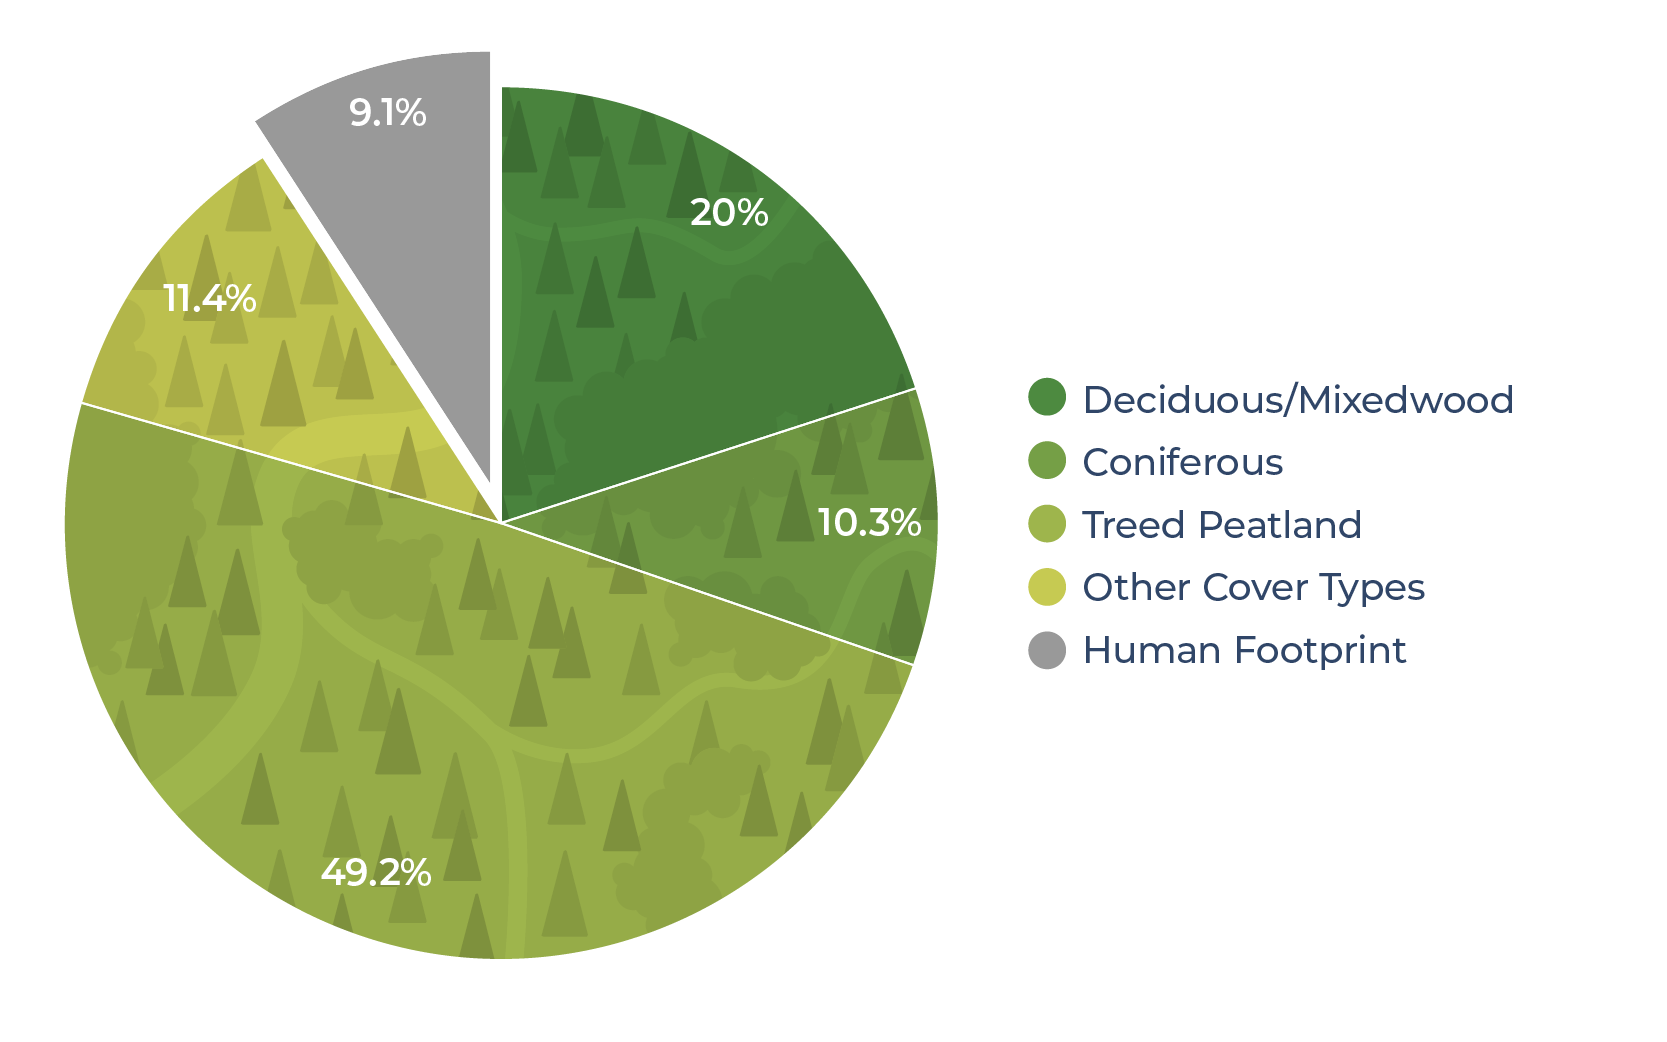
- In the Al-Pac FMA area, undisturbed upland stand types covered 30.4% of the land base as of 2023. Deciduous stands were the most common at 15.8%, followed by Pine (7.6%), mixedwood (4.3%), and White Spruce (2.7%).
- Undisturbed lowland vegetation types were also common, including Black Spruce (30.2%) and treed fen (18.9%).
- Other (non-forested) vegetation covered 8.7% of the region, and 2.7% of the area was open water (rivers and lakes).
View as Graph
Status of Vegetation Types. Per cent (%) and total area (km2), circa 2023, of vegetation types in the Al-Pac FMA area. Hover over the bar or legend to view the area of each vegetation type. Total FMA area is 63,688 km2.
View as Table
Status of Vegetation Types. Total (km2) and per cent (%) area, circa 2023, of vegetation types in the Al-Pac FMA area. Total FMA area is 63,688 km2.
Results
Annual rate of change: -0.6%
Annual rate of change: -0.5%
Annual rate of change: -0.6%
Annual rate of change: -0.1%
- Deciduous forest—the primary forest type in which Al-Pac operates—was the vegetation type most affected by human footprint between 1950 and 2023, with undisturbed area within this vegetation type decreasing by 3.6 percentage points (from 19.4% to 15.8%), with most of the disturbance occurring since 2000 (-2.2 percentage points).
- Mixedwood forest was the second most affected vegetation type, with undisturbed area declining by 1.2 percentage points (from 5.5% to 4.3%) between 1950 and 2023, with -0.5 percentage points since 2000.
- White Spruce stands, the least common forest type in the region, decreased by 1.0 percentage points (from 3.7% to 2.7%) due to footprint, with 0.3 percentage points disturbed since 2000. Pine stands decreased by 0.2 percentage points since 2000.
- Annual rates of change for deciduous, mixedwood, and White Spruce forests were similar between 2000 and 2023, ranging from -0.5% to -0.6% per year. In contrast, pine declined more slowly, at -0.1% per year.
- Treed fen and Black Spruce forests—together covering about 50% of the Al-Pac FMA—declined only slightly from 1950 to 2023. As forestry activities primarily target upland forest types, these losses were largely driven by scattered energy footprint, with transportation and urban/industrial development contributing to a lesser extent.
View as Graph
Trend in Vegetation Types. Trends in the per cent area of stand types in the Al-Pac FMA area between 1950 and 2023, with data available for 1950, 1985, and annually from 2000 to 2023 (excluding 2002–2003). Hover over categories in the legend to highlight the corresponding trend line. Hover over trend lines to see data values. Error bars represent 95% confidence intervals.
View as Table
Trend in Vegetation Types. Trends in the per cent area of stand types in the Al-Pac FMA area between 1950 and 2023, with data available for 1950, 1985, and annually from 2000 to 2023 (excluding 2002–2003). The trend table summarizes the changes between 1950 and 2023.
Annual rate of change: +3.0%
Annual rate of change: -0.3%
Annual rate of change: -1.0%
Annual rate of change: +3.2%

Annual rate of change: +4%
Note: The values discussed in this section do not yet account for forest recovery as disturbed areas regrow.
- Using a 100-year cutoff to define old forest, there was a notable increase in old deciduous (+2.0 percentage points) and Black Spruce (+5.3 percentage points) stands in the Al-Pac FMA area between 2000 and 2023.
- Old Pine stands also showed a modest increase (+0.4 percentage points), and the area of old mixedwood stands remained stable.
- In contrast, old White Spruce stands declined by 0.5 percentage points, representing an average annual rate of decline of nearly 1% per year.
View as Graph
Trend in Old Forest. Trend in the per cent area of old forest (>100 years) by stand type in the Al-Pac FMA area from 2000 to 2023 (excluding 2002–2003). Hover over categories in the legend to highlight the corresponding trend line. Hover over trend lines to see data values. Error bars represent 95% confidence intervals.
View as Table
Trend in Old Forest. Trend in the per cent area of old forest (>100 years) by stand type in the Al-Pac FMA area between 2000 and 2023 (excluding 2002–2003).
References
Sanderson, E.W., M. Jaiteh, M.A. Levy, K.H. Redford, A.V. Wannebo, and G. Wolmer. 2002. The human footprint and the last of the wild. Bioscience 52(10):891-904.
Methods for summarizing undisturbed native vegetation are described in Section 1.3.1.
