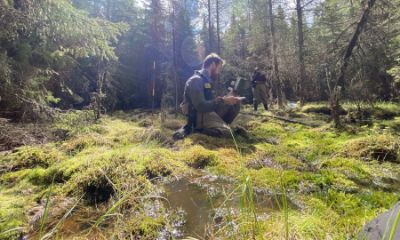
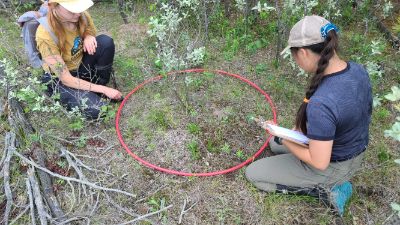
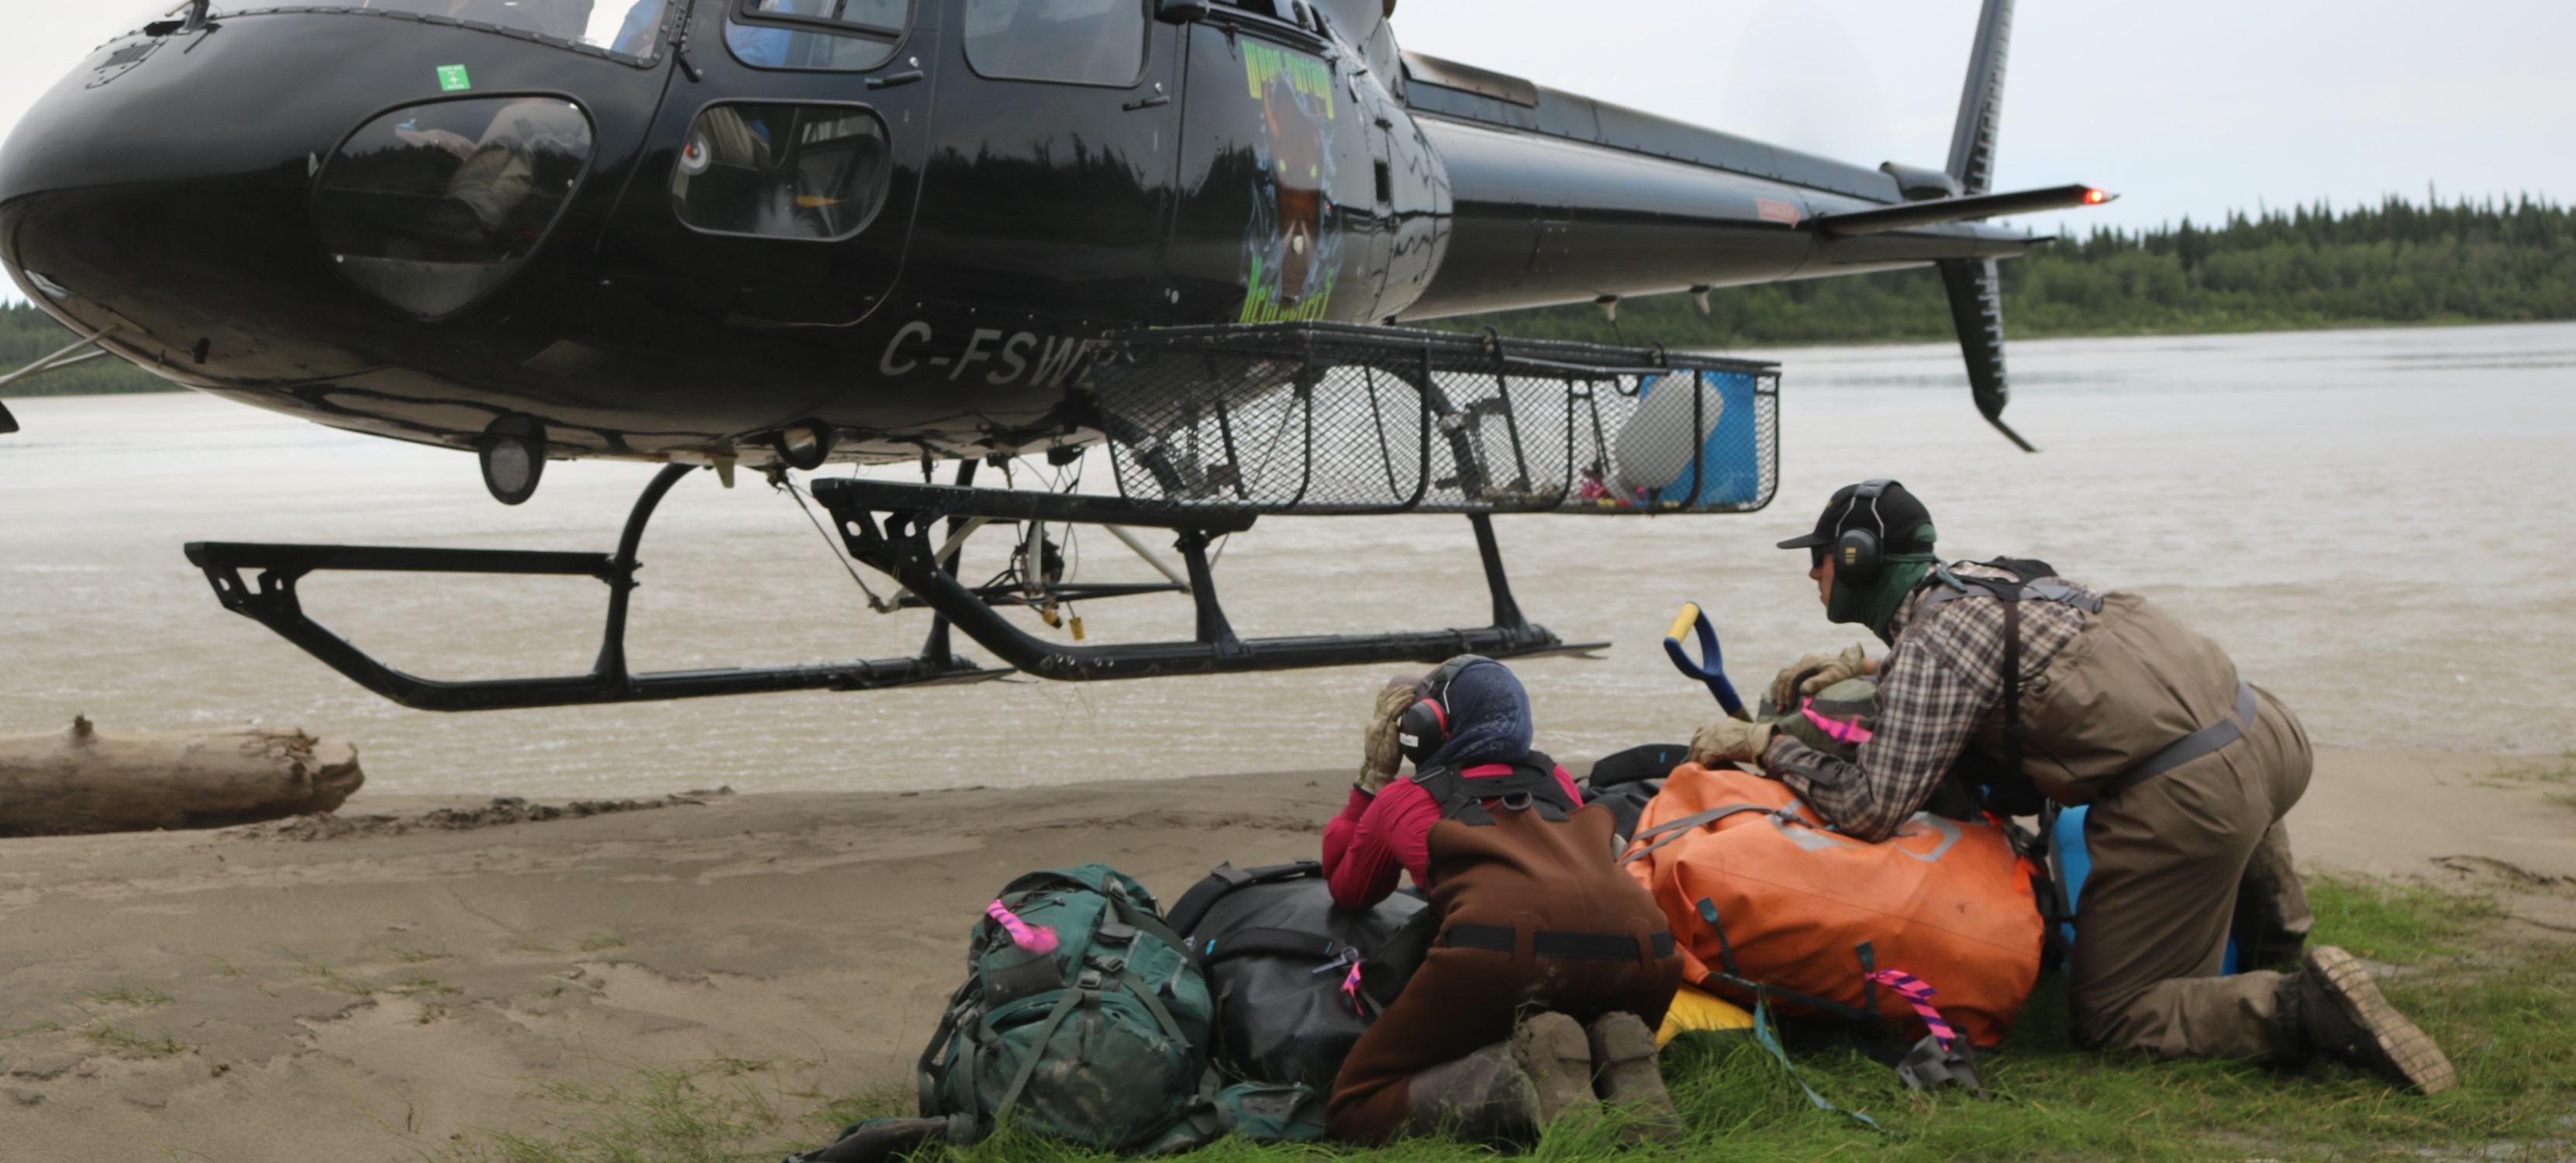
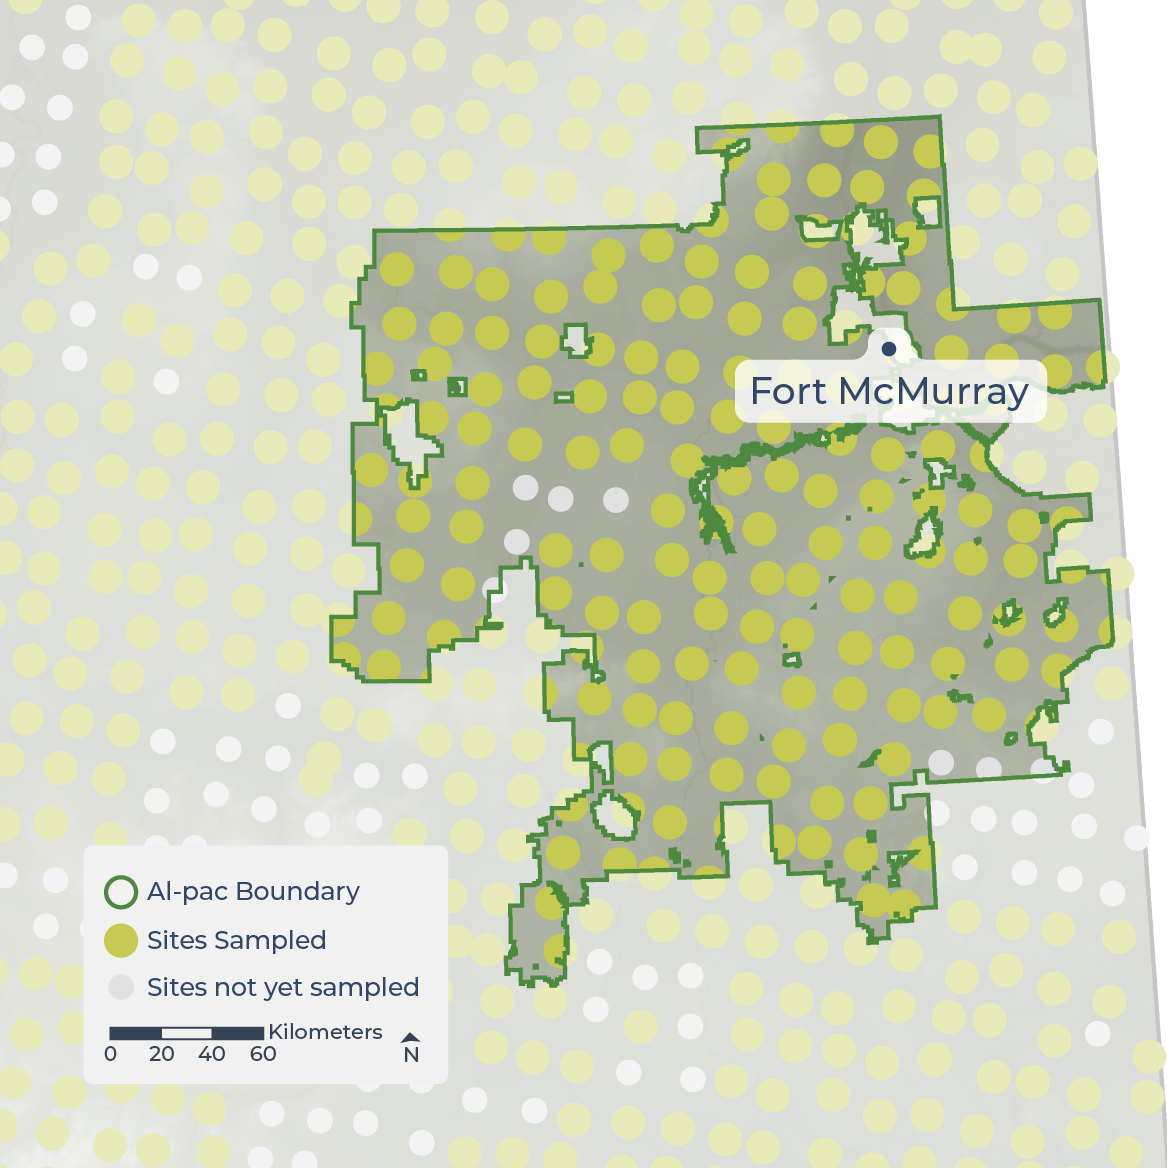
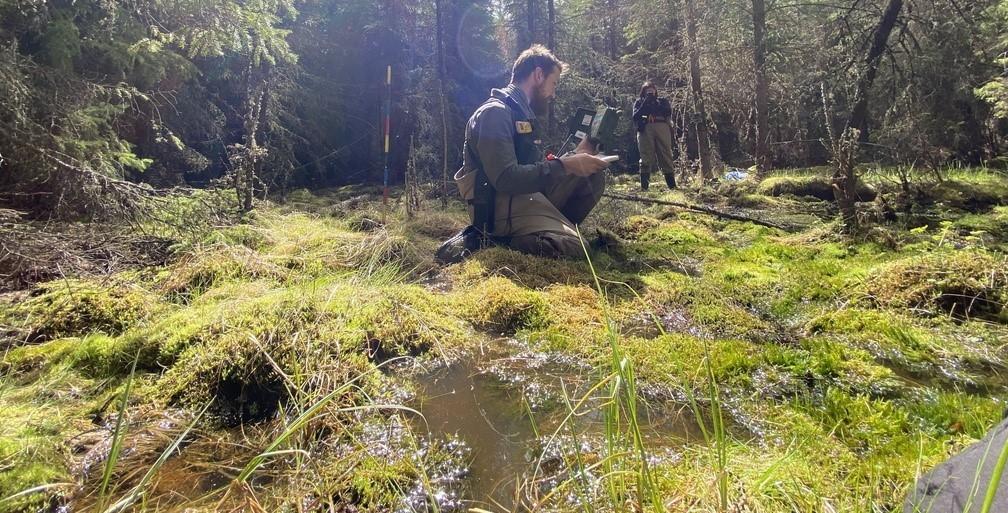
Review the methods for the indicators summarized in Chapter 2: native vegetation (2.1), native cover (2.2), interior native habitat (2.3), and landscape connectivity (2.4).
General Terms and Conditions / All Rights Reserved
All the features necessary to navigate this report can be found in the bookmark on the left side of the screen. These features include:
The main menu is accessed through the hamburger menu. This report is divided into seven sections, including the Report Summary. From the menu, you can access any of the chapters and their subsections from anywhere in the report.
The "page turner" arrows at the bottom left of your screen will sequentially take you through the report, page by page. For example, press the right arrow to move from Section 2.1 to Section 2.2.
Tip: If you’re interested in the full report, we encourage you to start with the Introduction in Chapter 1 and use the page turner function to sequentially navigate through the report.
Summary of the methods used to define indicators, analyze data, and present information for the Al-Pac FMA area.
Methods for ABMI indicators included in this report are summarized under three themes:
Monitoring Sites. Location of ABMI monitoring sites within Al-Pac’s FMA area. Data from these sites, along with additional off-grid sampling, were used to report on biodiversity indicators.
Introduction
The ABMI employs a systematic grid of 1,656 site locations, spaced 20 km apart, to collect biodiversity information, including species and habitat data, at both terrestrial and wetland sites[1]. We also monitor at other “targeted” sites as needed to address additional monitoring and research objectives.
At each location, ABMI technicians record the species that are present and measure a variety of habitat characteristics. For species that cannot be identified in the field (e.g., soil mites, lichens), samples are sent to ABMI taxonomists to sort, identify, and archive to complete the institute’s species-level dataset.
In addition to the ABMI's species monitoring, the ABMI uses remote sensing data and tools to map and monitor Alberta's landscapes and human footprint. One of our principal goals is to understand the distribution of land cover types at a given point in time and how habitats have changed or are changing. This work brings together diverse data (e.g., ground, airborne, space-borne) and a range of tools and technologies (e.g., cloud-computing, machine learning, photogrammetry) to produce map products and datasets. These products are used to summarize land cover indicators across the province.
Methods in this section are organized into three indicator themes: Natural Landscape Indicators, Land Base Change Indicators, and Biodiversity Indicators. Methods for the research spotlights are summarized in their respective sections, with references provided for full methodological details.
Review the methods for the indicators summarized in Chapter 2: native vegetation (2.1), native cover (2.2), interior native habitat (2.3), and landscape connectivity (2.4).
Review the methods for the indicators summarized in Chapter 3: human footprint (3.1), land base change (3.2), and linear features (3.3).
Review the methods for the indicators summarized in Chapter 4 and 5: biodiversity intactness (4.1), sector effects (4.2), attribution of species habitat change (4.3), species of conservation concern (5.1), and non-native vascular plants (5.2).
References
Alberta Biodiversity Monitoring Institute (ABMI). 2021. Terrestrial Field Data Collection Protocols (Abridged Version). Available at: https://abmi.ca/publication/601.html.